Create a visual dashboard within Keap!
Your 30 minute demo includes how to:
Simple, powerful, affordable. See it for yourself by booking your Graphly demo now.
Where Performance Is Measured, Performance Improves.
Where performance is measured and reported the rate of improvement accelerates.
Marketing
Monitor website traffic, record dynamic lead sources, measure funnel conversions, tweak, improve & repeat.
Sales
Track individual sales rep performance, forecast revenue, view gross & net revenue numbers.
Customer Service
View net promoter surveys, fulfill on orders, improve retention rates, deliver & satisfy.
Popular Reports
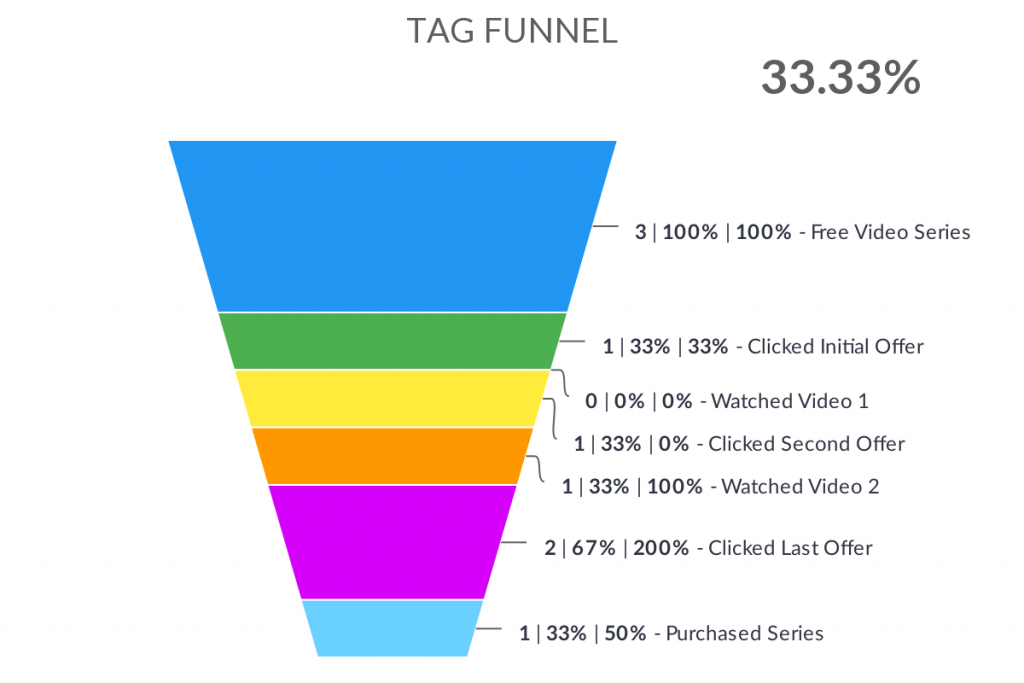
Tag Funnel
Displays the number of contacts in a list of tags over a given date range.
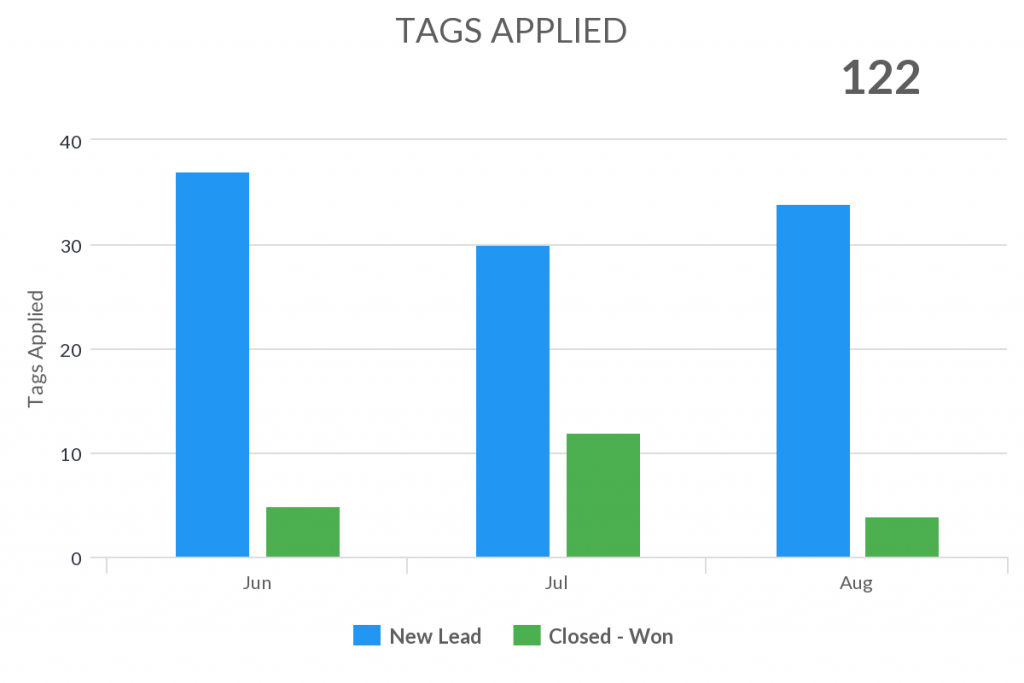
Tag Applied
See how many tags get applied to contacts during a period of time.
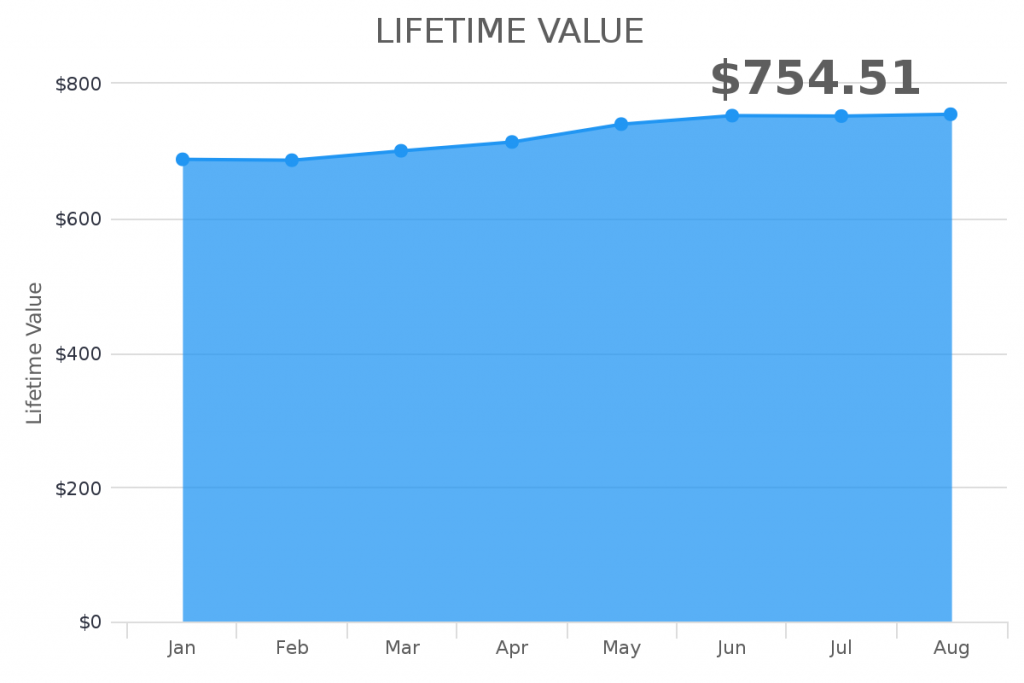
Lifetime Value
See the trend of the current lifetime value of your customers throughout a time frame you choose.
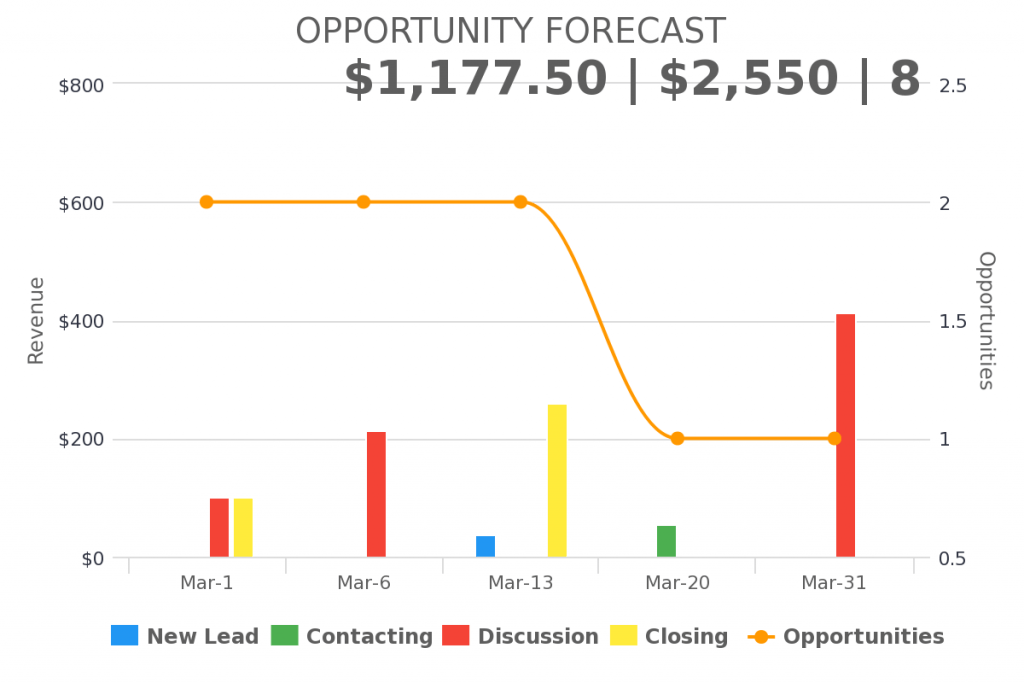
Opportunity Forecast
Forecast the adjusted revenue of active opportunities based on the stage probability.
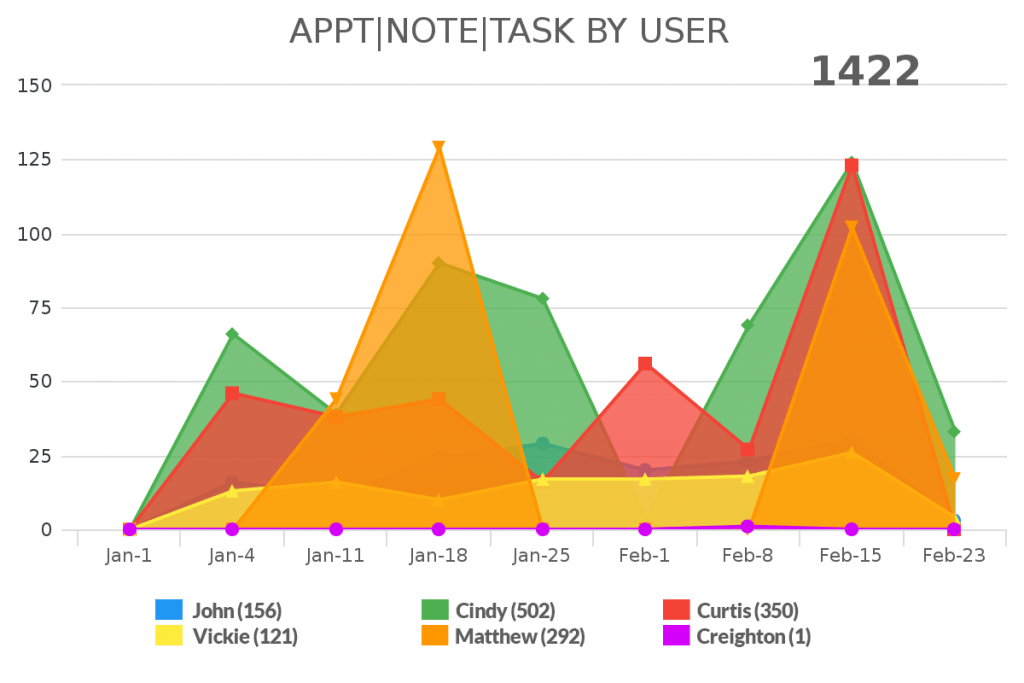
Appt|Note|Task by User
Show the appointment, notes, and tasks for each user to compare them to each other.
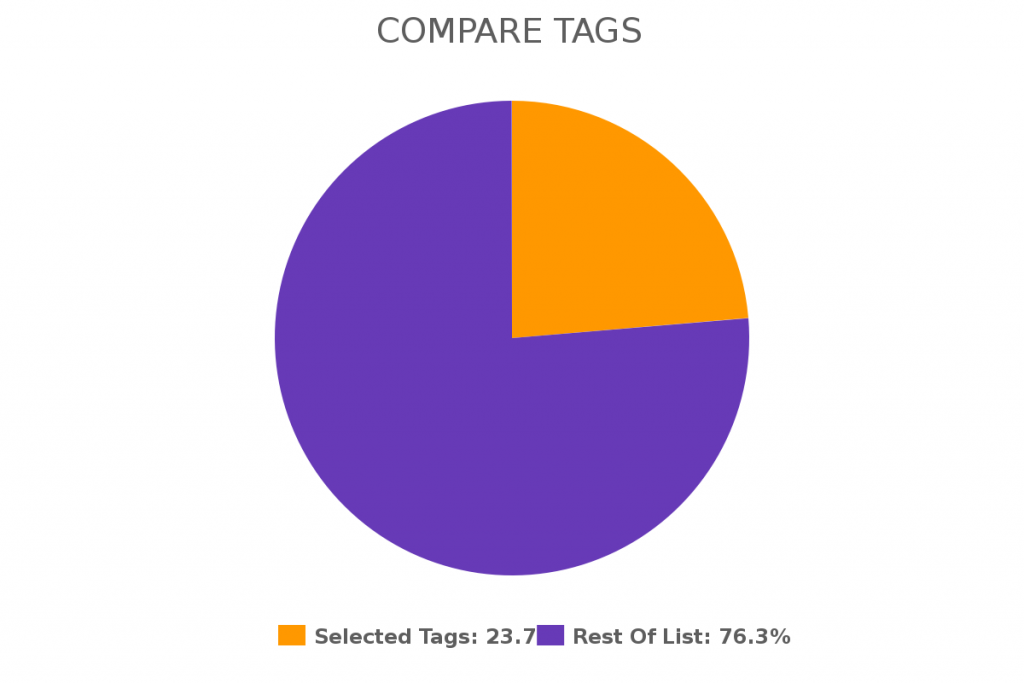
Compare Tags
Compare the number of contacts with tags to each other or to your entire list in a pie chart.