Reports
Checkout Graphly’s growing library of reports and report templates.
How it works
Graphly has over 150 Report Templates. A template simply guides you in a direction, pulling data from specific tables. Each report template can produce 5, 10, 15+ reports depending on how you configure the options and what statements you add to the criteria builder. If you don’t see a report you’re looking for, please let us know.
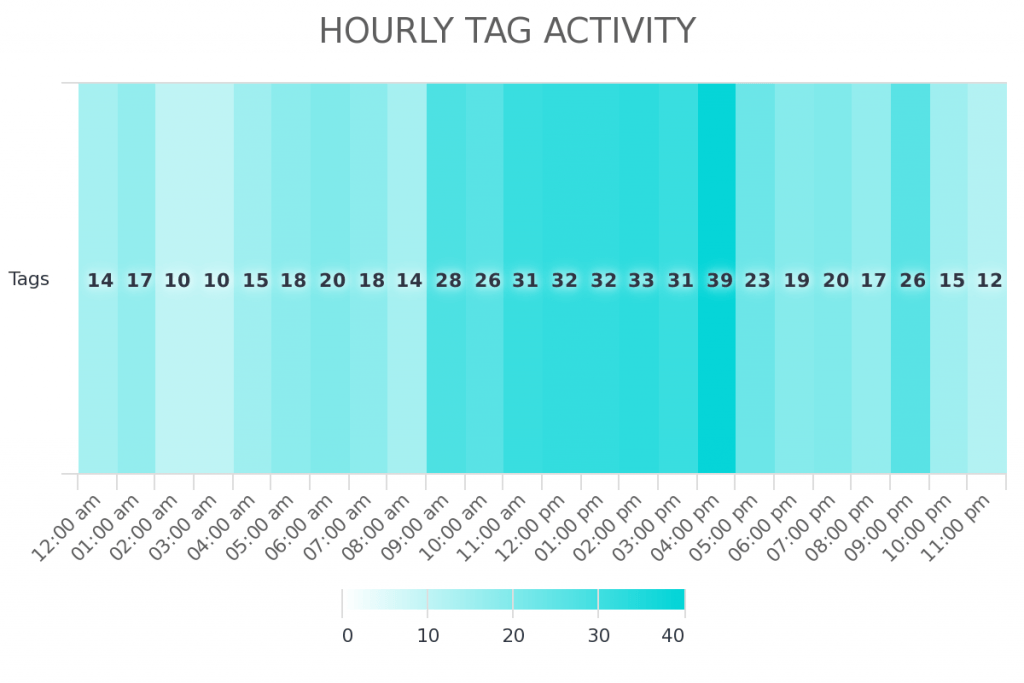
Hourly Tag Activity
Shows the time of day which tags are applied.
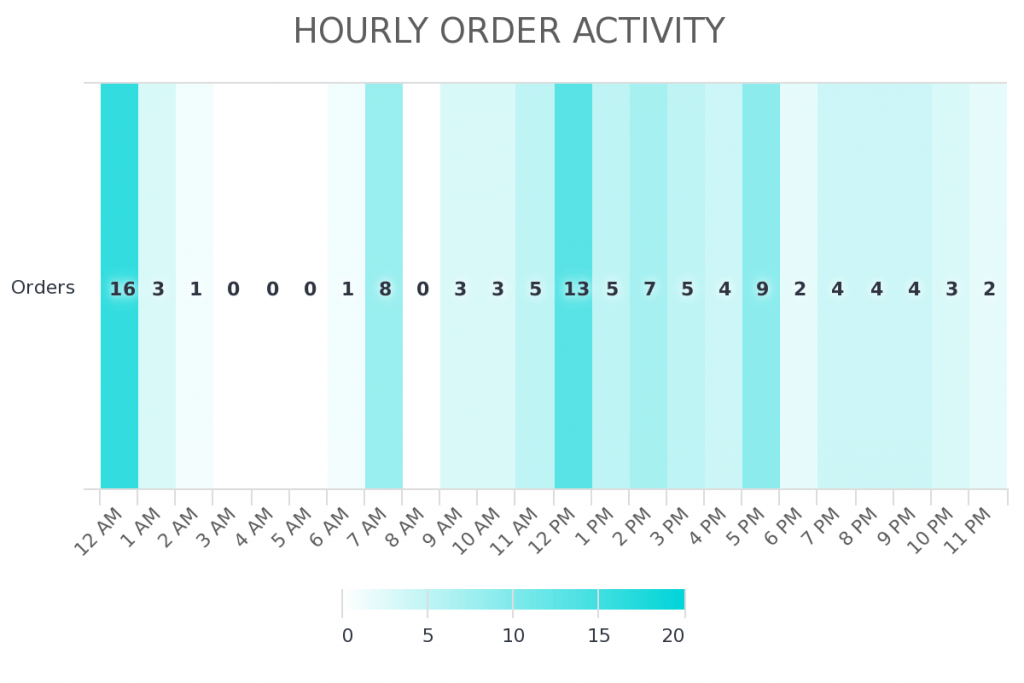
Hourly Order Activity
Shows the time of the day that people purchase from you.
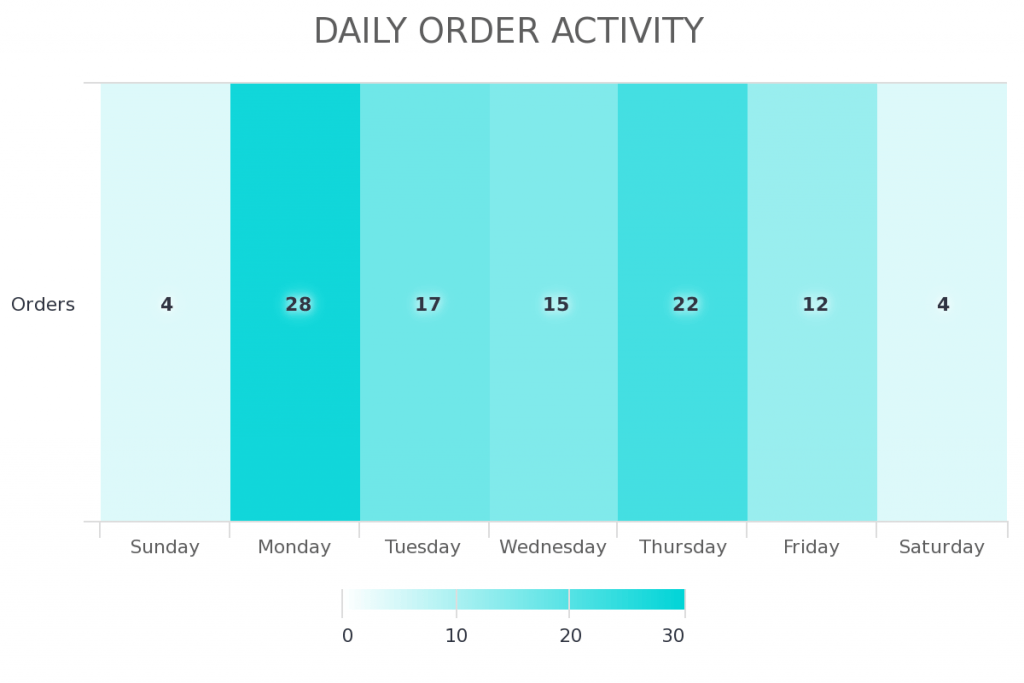
Daily Order Activity
Shows the days people purchase from you.
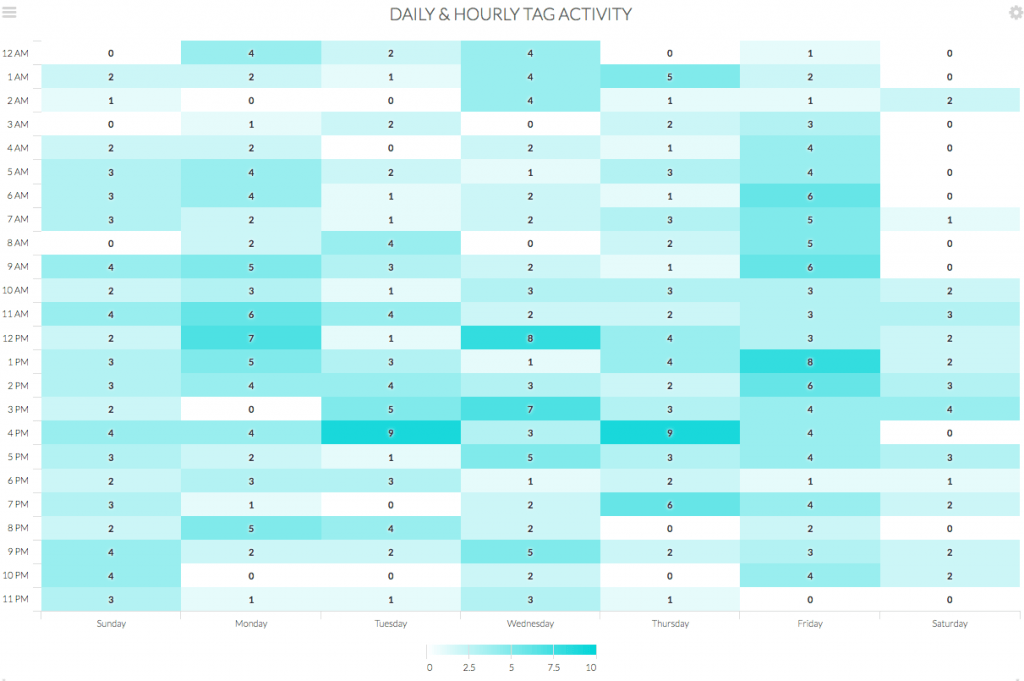
Daily & Hourly Tag Activity
Shows the day and time which tags are applied.
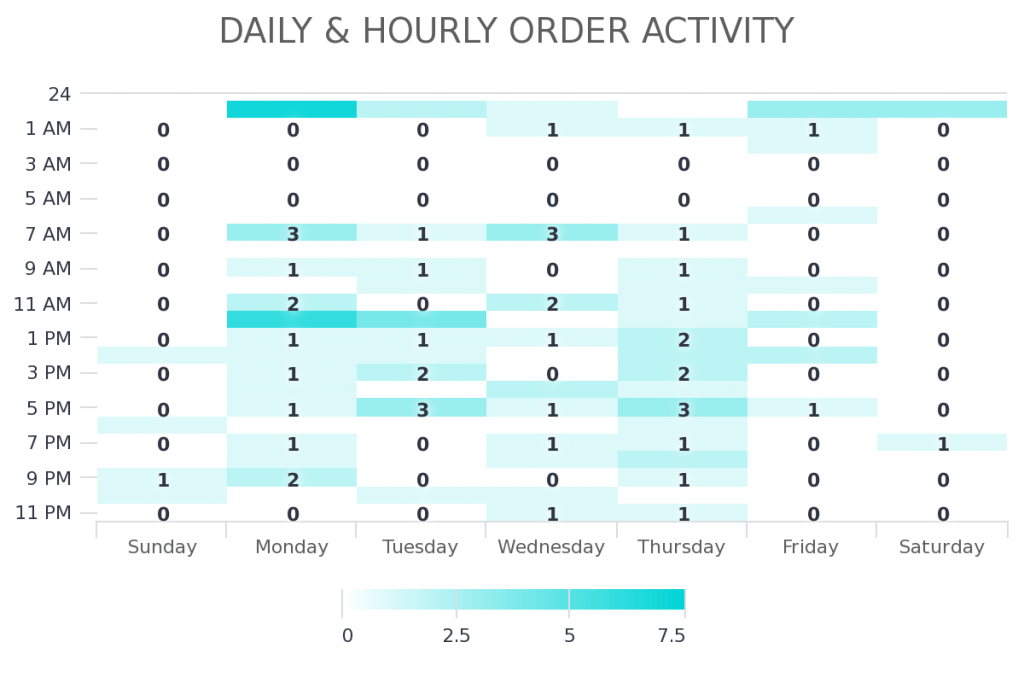
Daily & Hourly Order Activity
Shows the day and time people purchase from you.
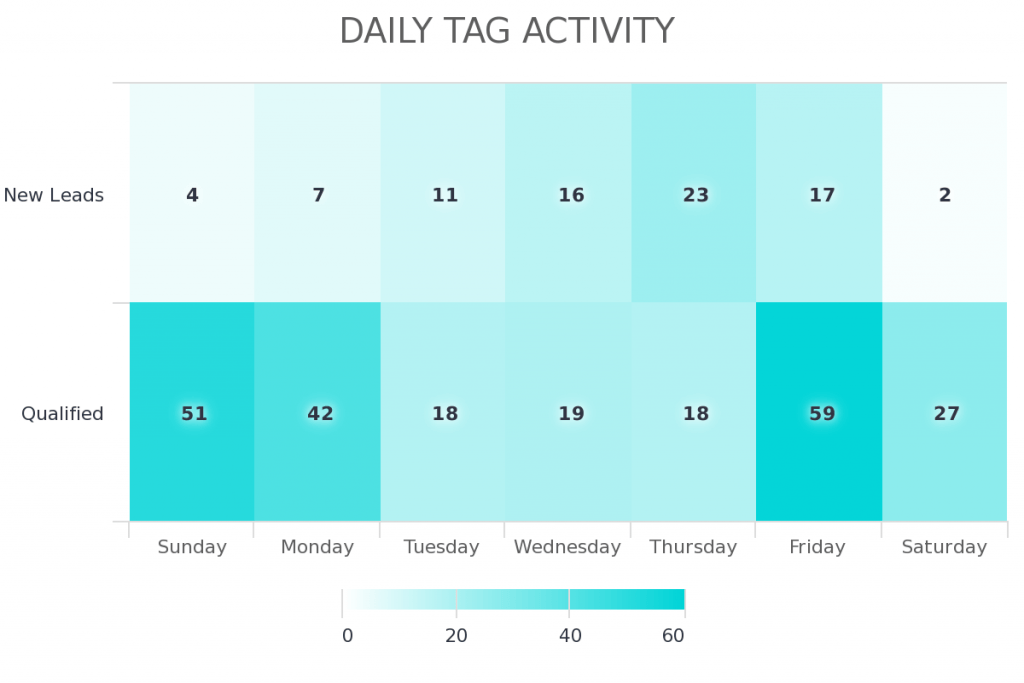
Daily Tag Activity
This report shows the days which certain tags are applied.
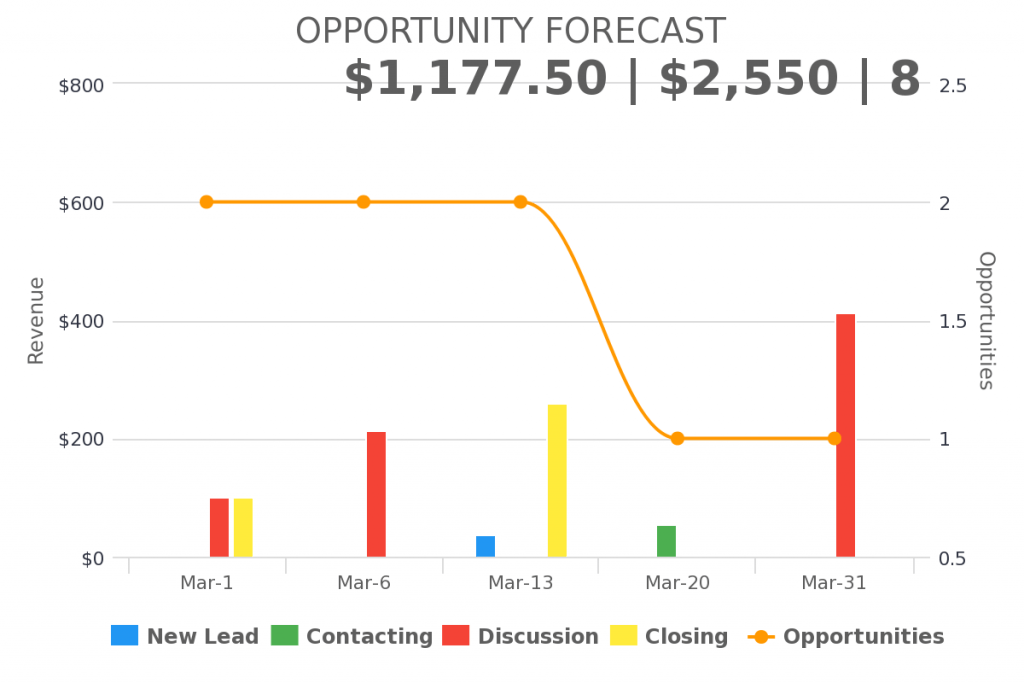
Opportunity Forecast
Forecast the adjusted revenue of active opportunities based on the stage probability.
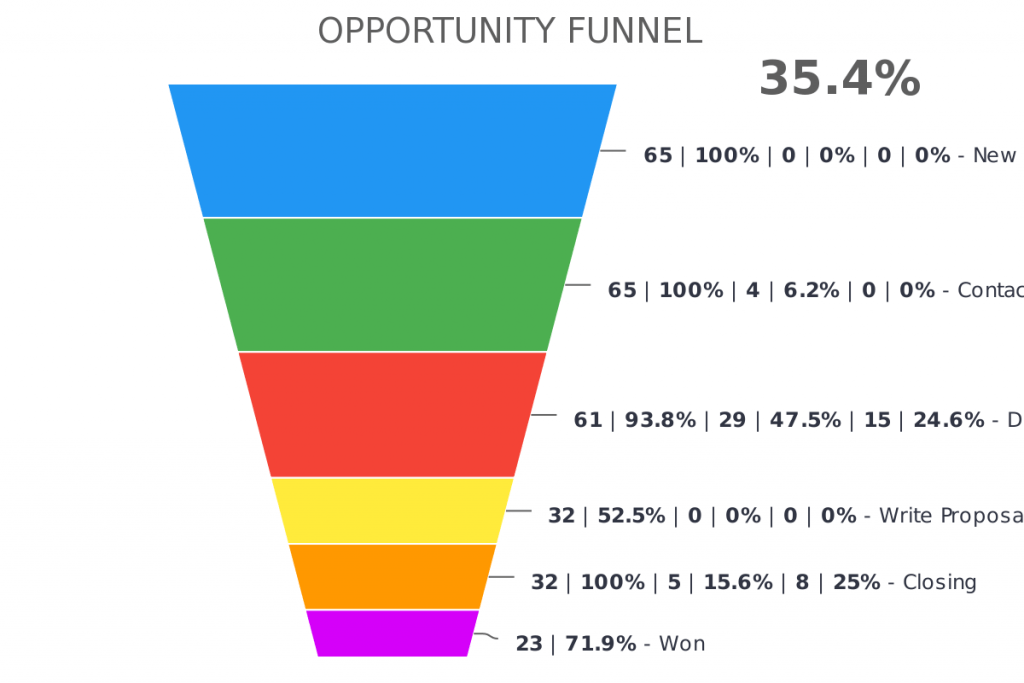
Opportunity Funnel
Shows the conversion rate and exit rate of any stage in your pipeline.
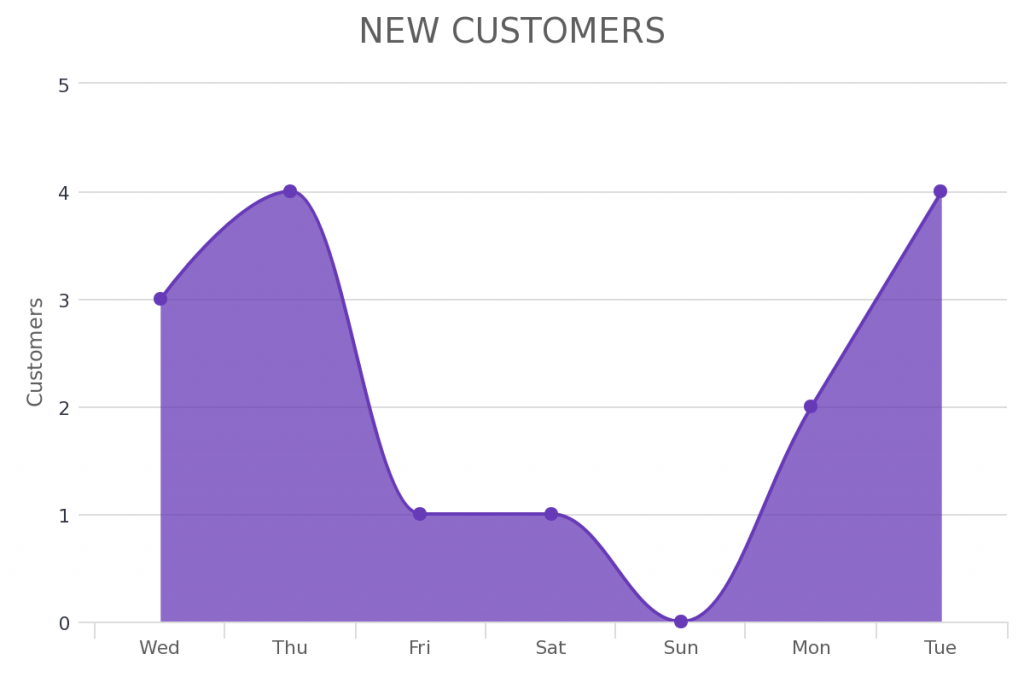
New Customers
See the total number of new customers over a given time frame.
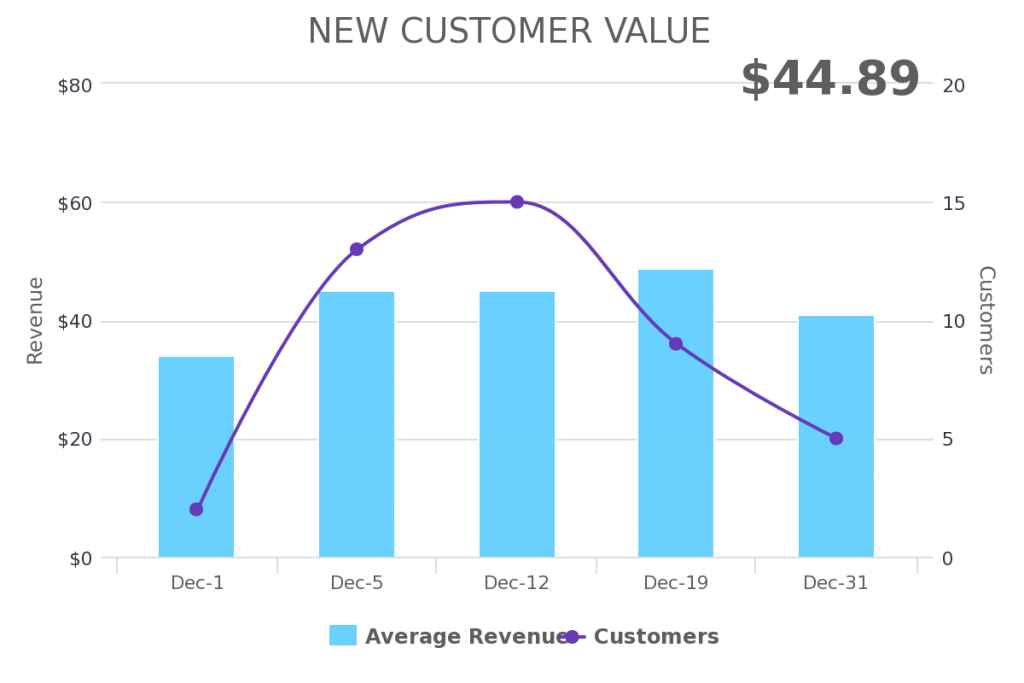
New Customer Value
See the average, high, low of new customers first purchase.
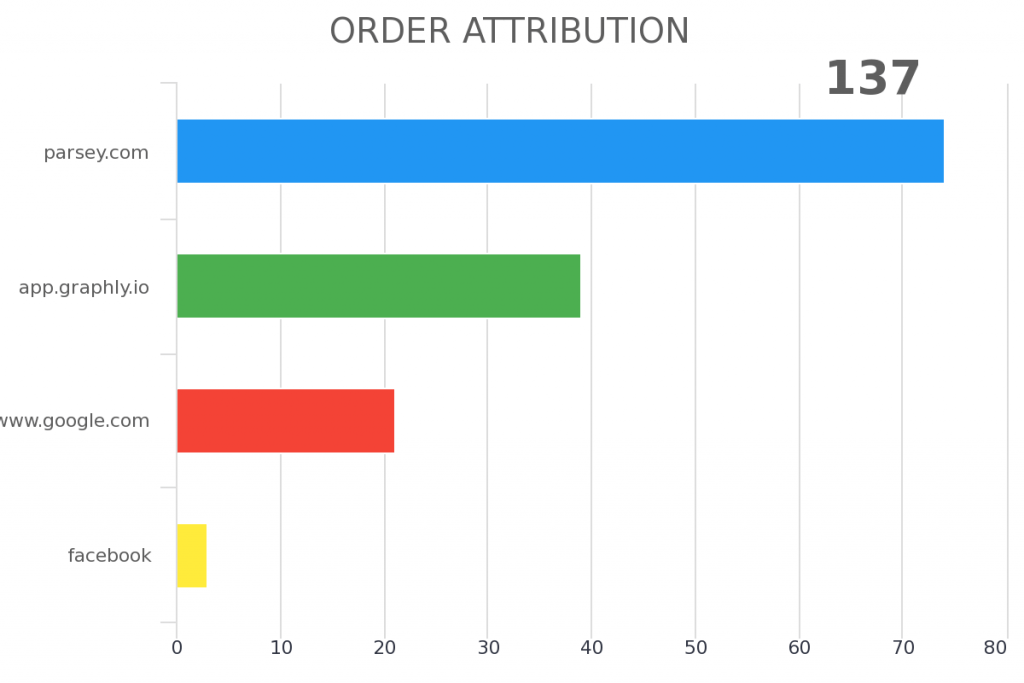
Order Attribution
Select the UTM parameters you want to see for orders getting created.
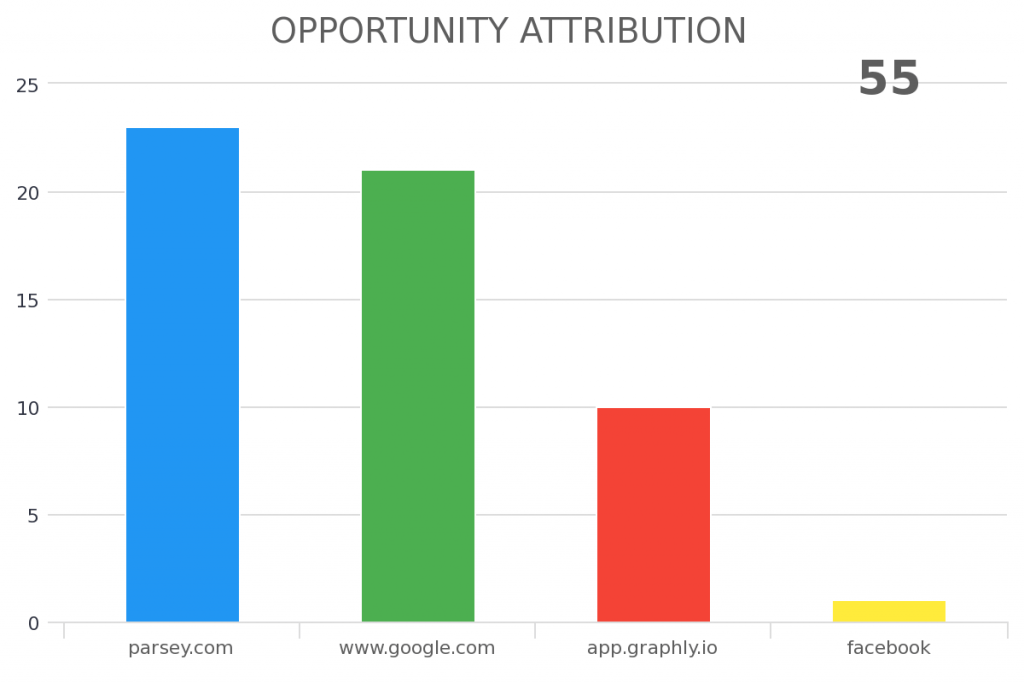
Opportunity Attribution
Select the UTM parameters you want to see for opportunities getting created.
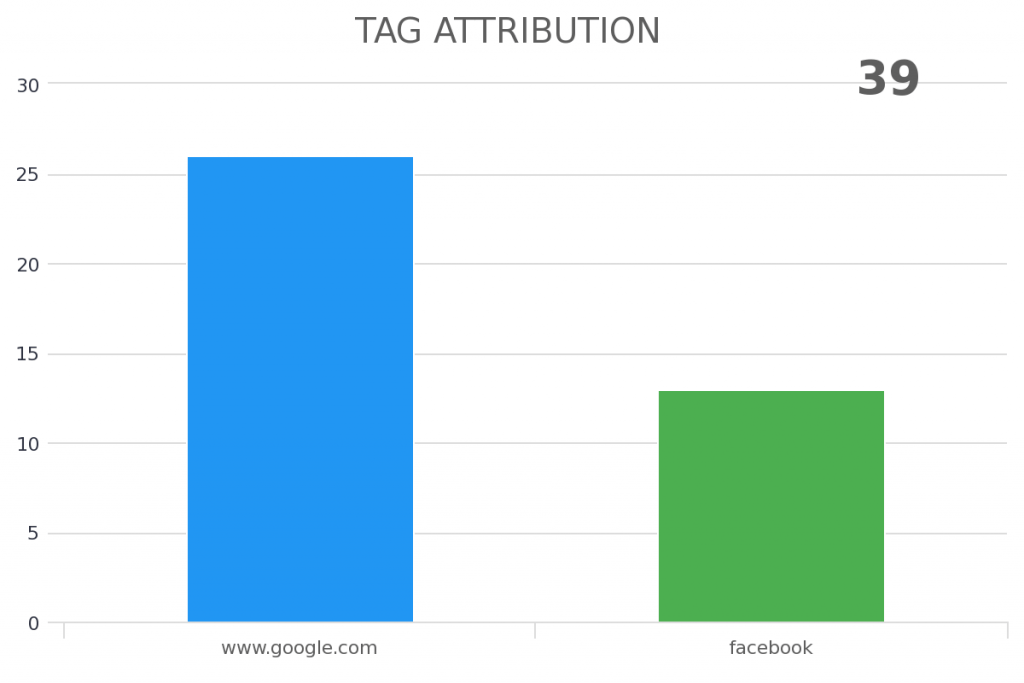
Tag Attribution
Select the UTM parameters you want to see for tags getting applied.
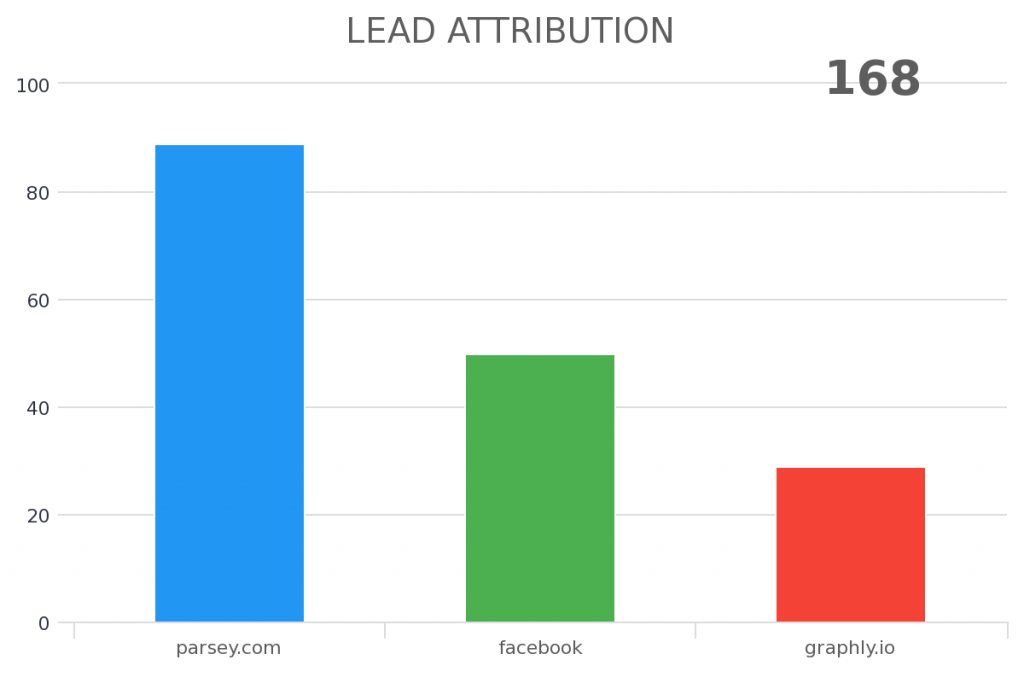
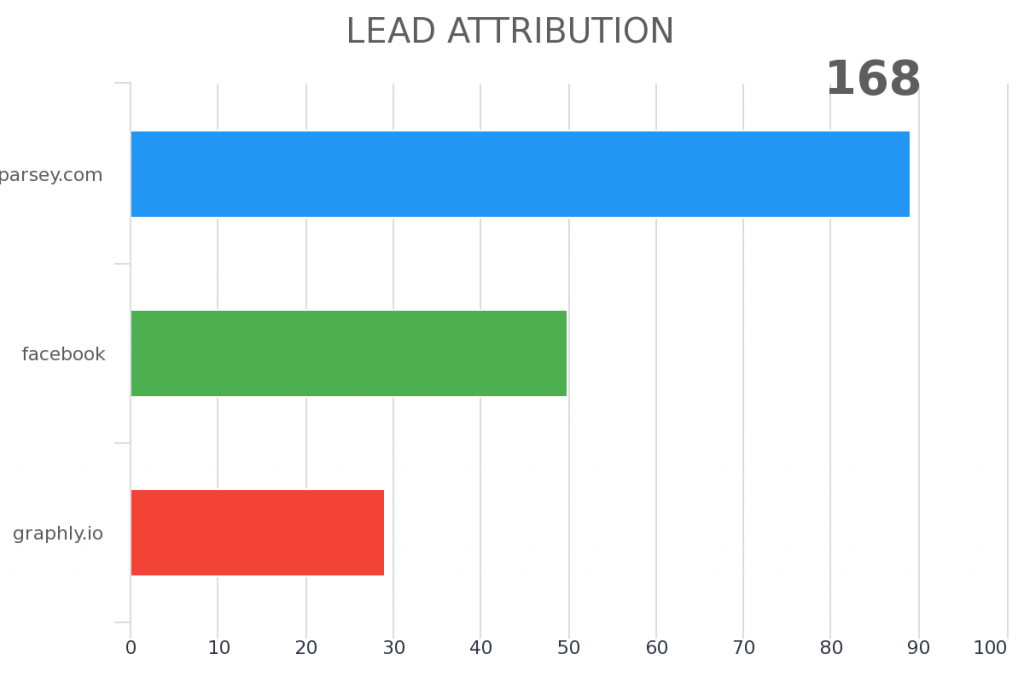
Lead Attribution
Select the UTM parameters you want to see for list growth.
Top Opportunity Attribution
See the UTM parameters responsible for opportunities getting created.
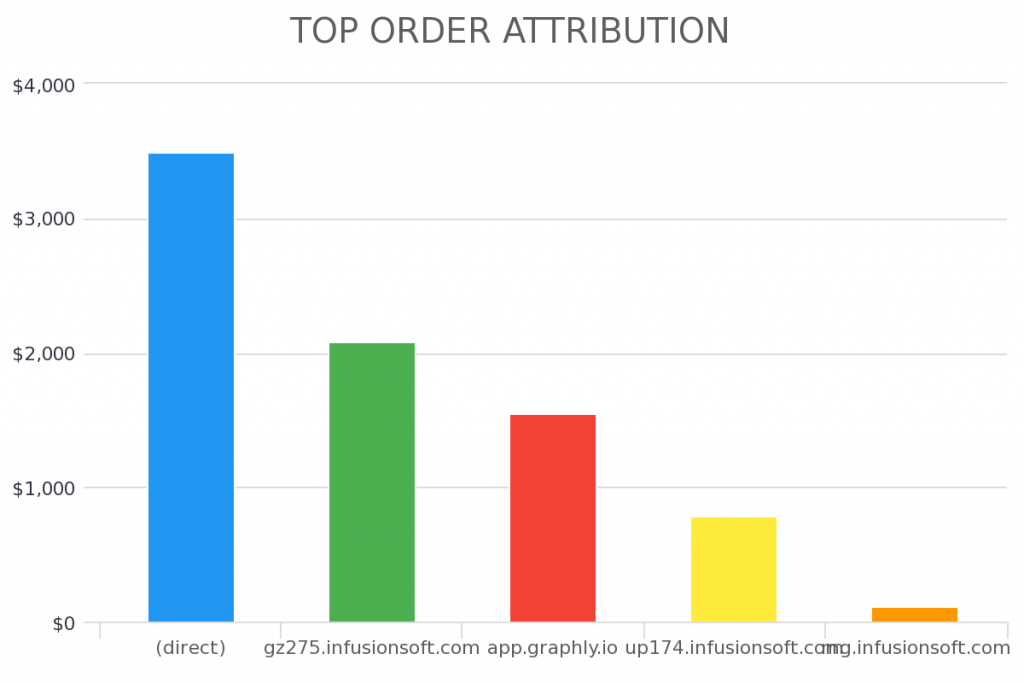
Top Order Attribution
See the UTM parameters responsible for orders getting created.
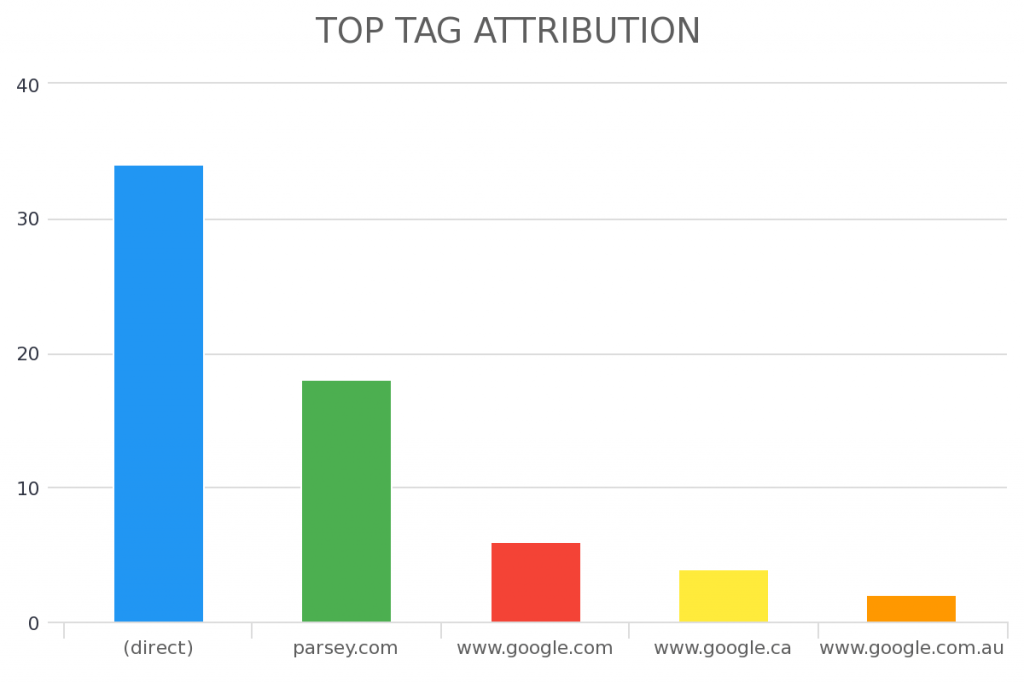
Top Tag Attribution
See the UTM parameters responsible for tags getting applied.
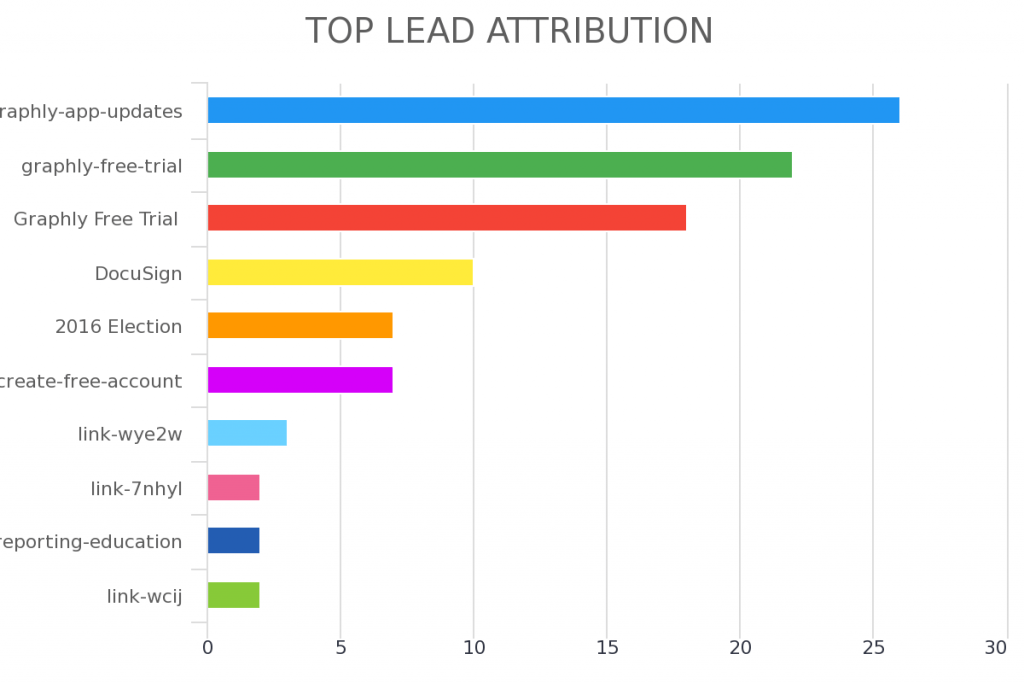
Top Lead Attribution
See the UTM parameters responsible for list growth.
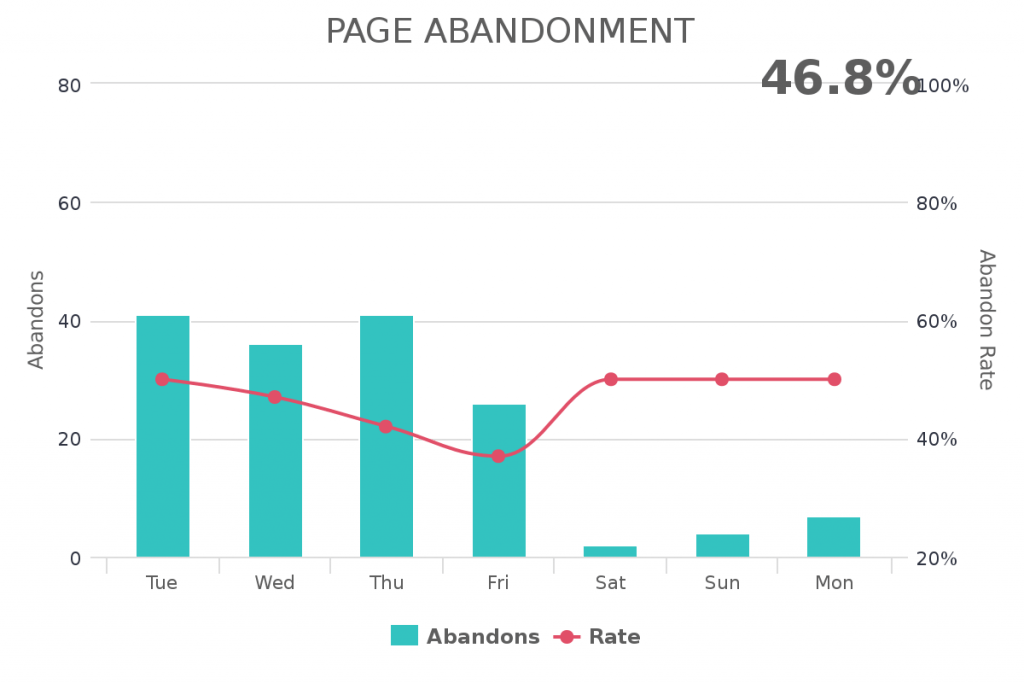
Page Abandonment
See the abandons of a page over a given date range.
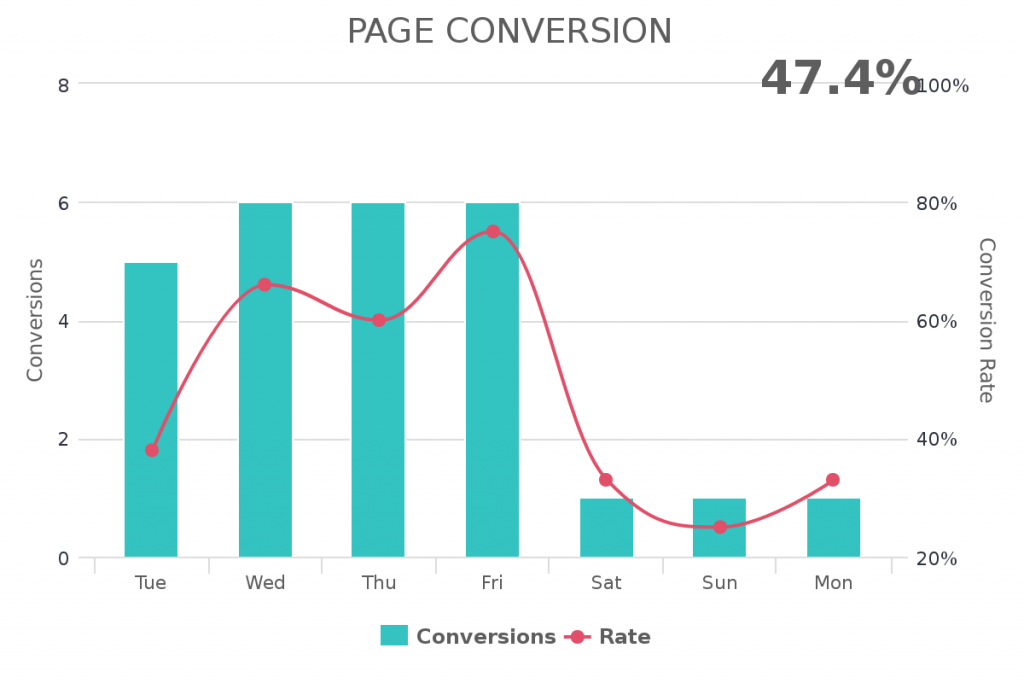
Page Conversion
See how a page converts to the next page over a given date range.
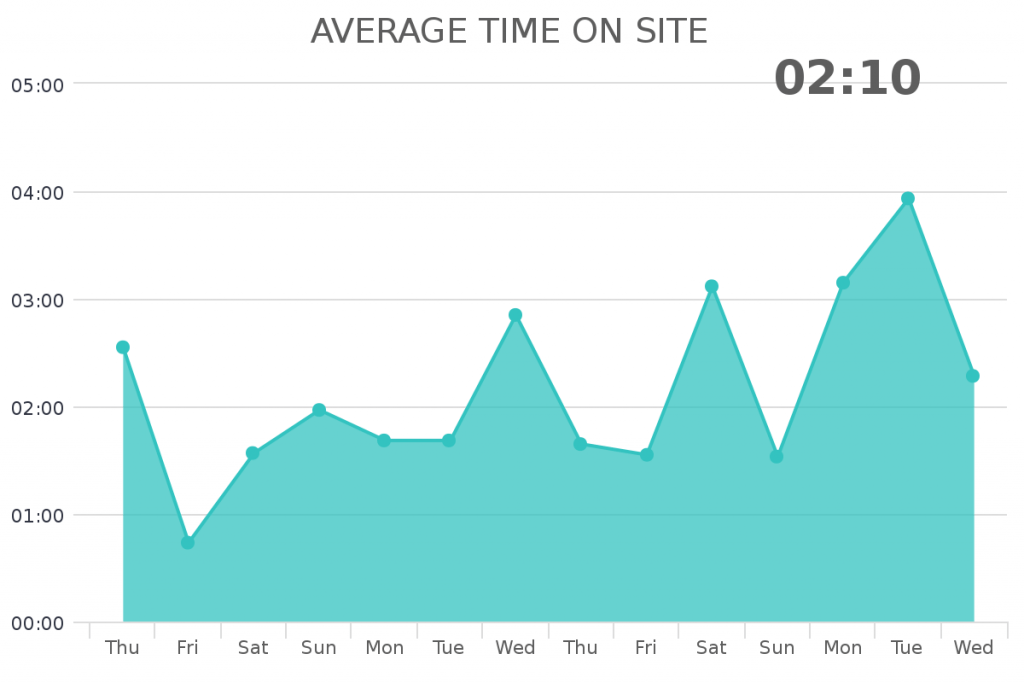
Average Time On Site
See the average time on your site for each visit, over a given date range.
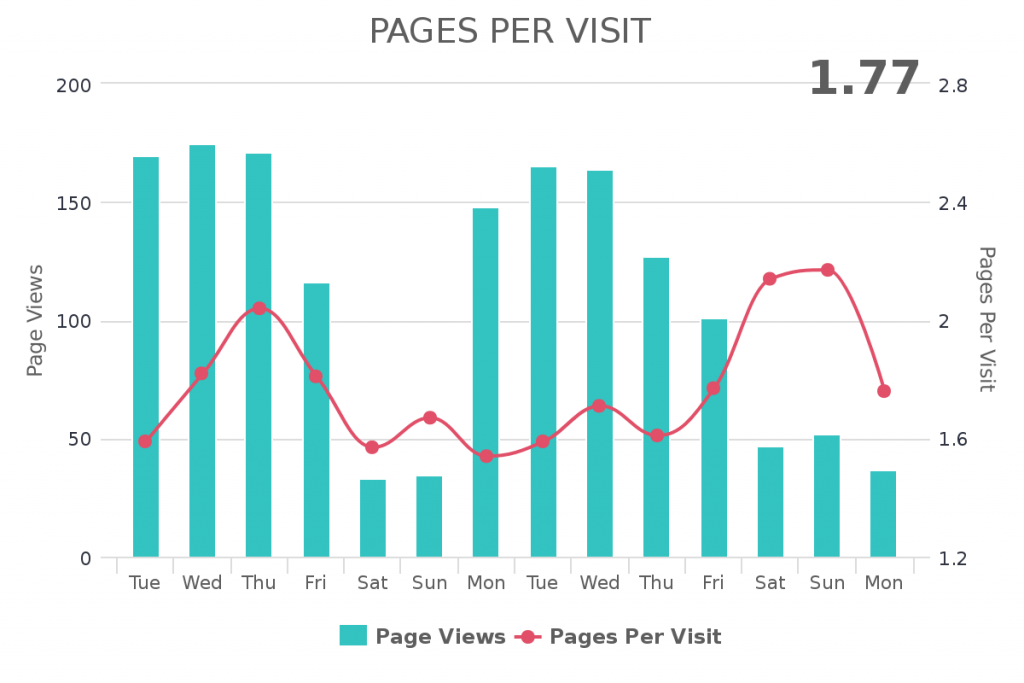
Pages Per Visit
See the average pages viewed for each visit to your website over a given date range.
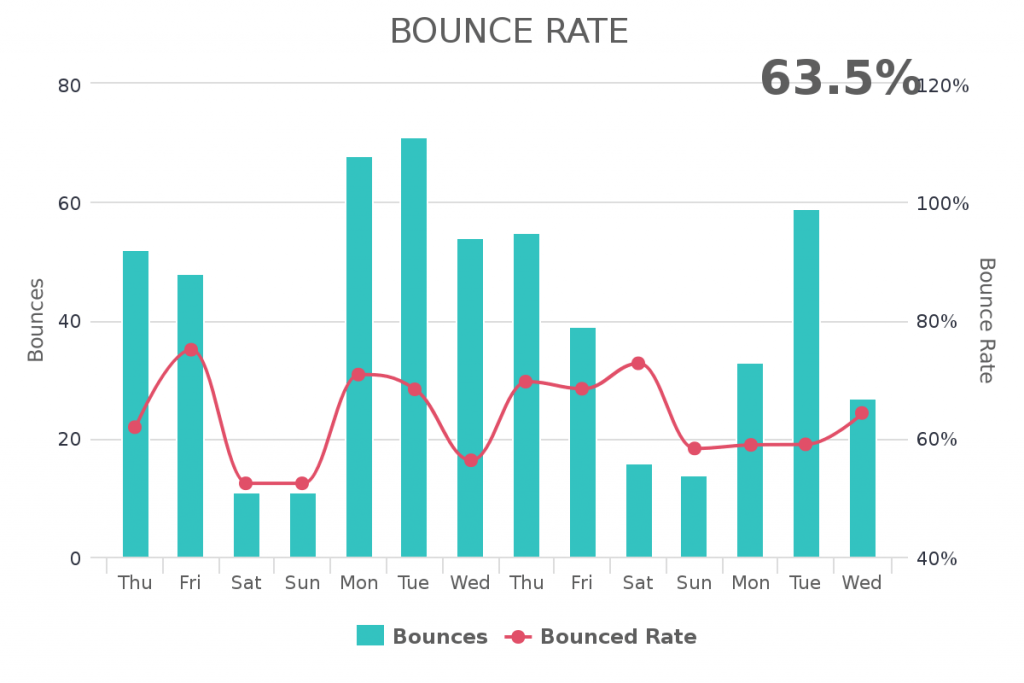
Bounce Rate
See the average bounce rate of visits to your website over a given date range.
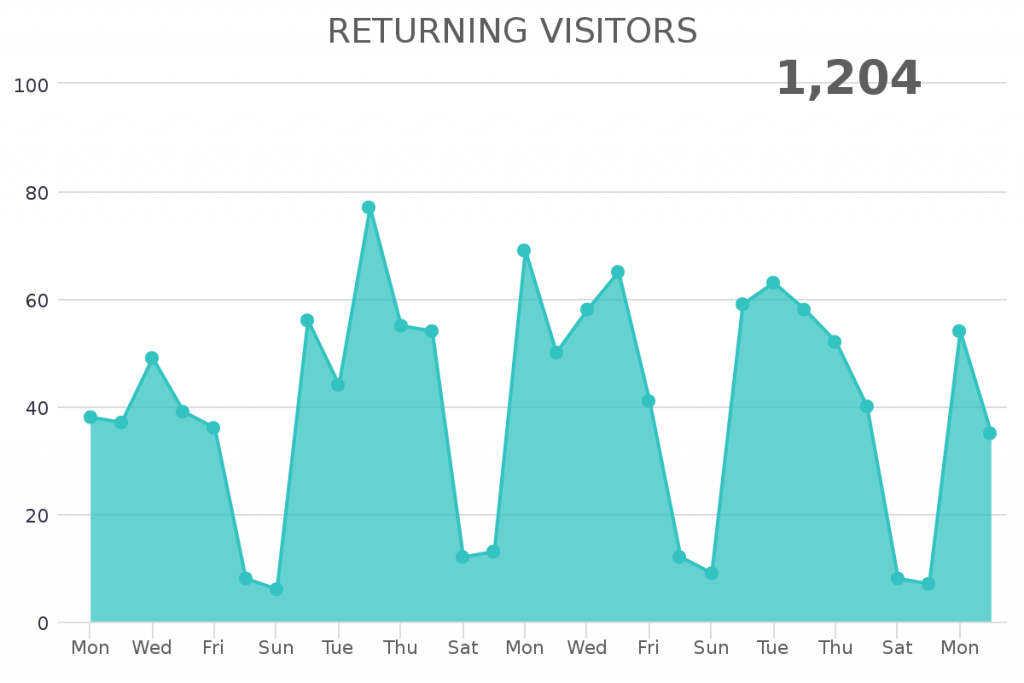
Returning Visitors
See the number of returning visitors to your website over a given date range.
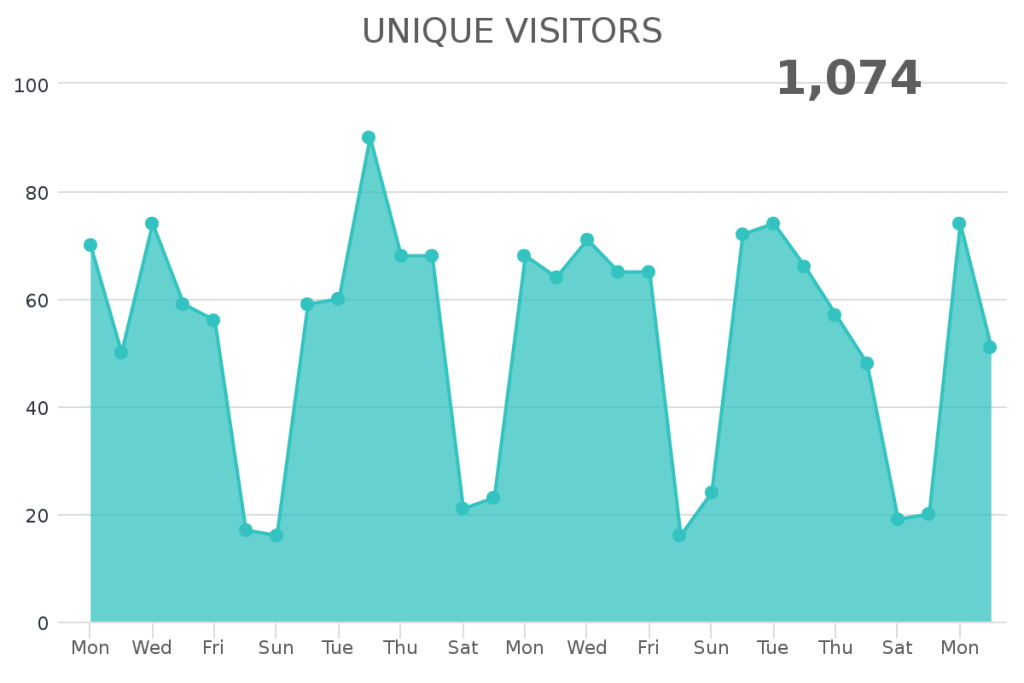
Unique Visitors
See the number of unique visitors to your website over a given date range.
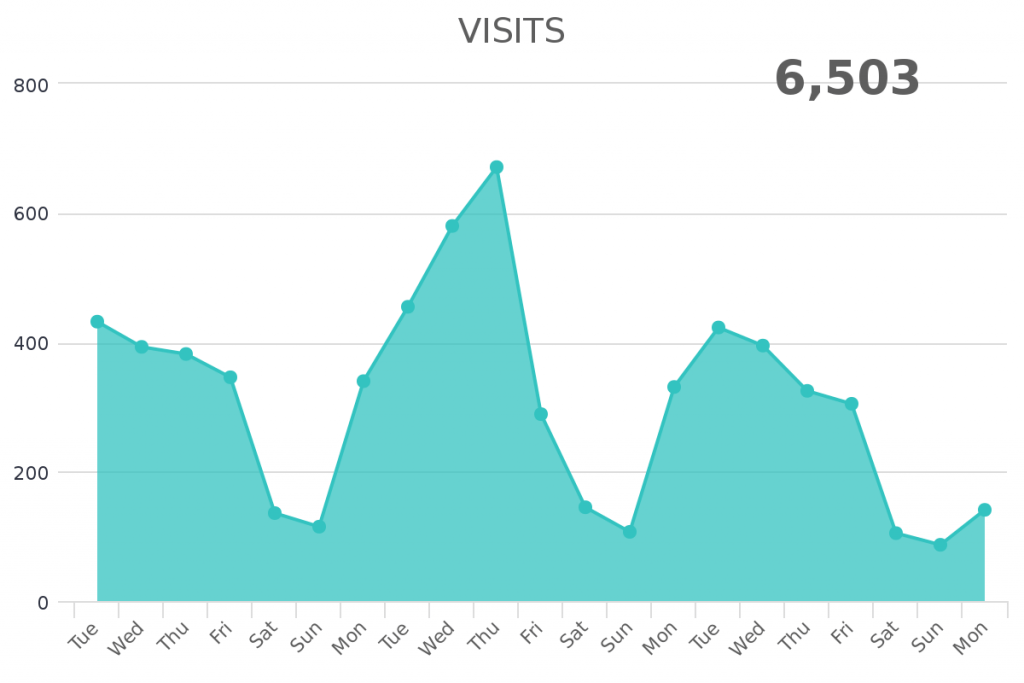
Visits
See the number of visits to your website over a given date range.
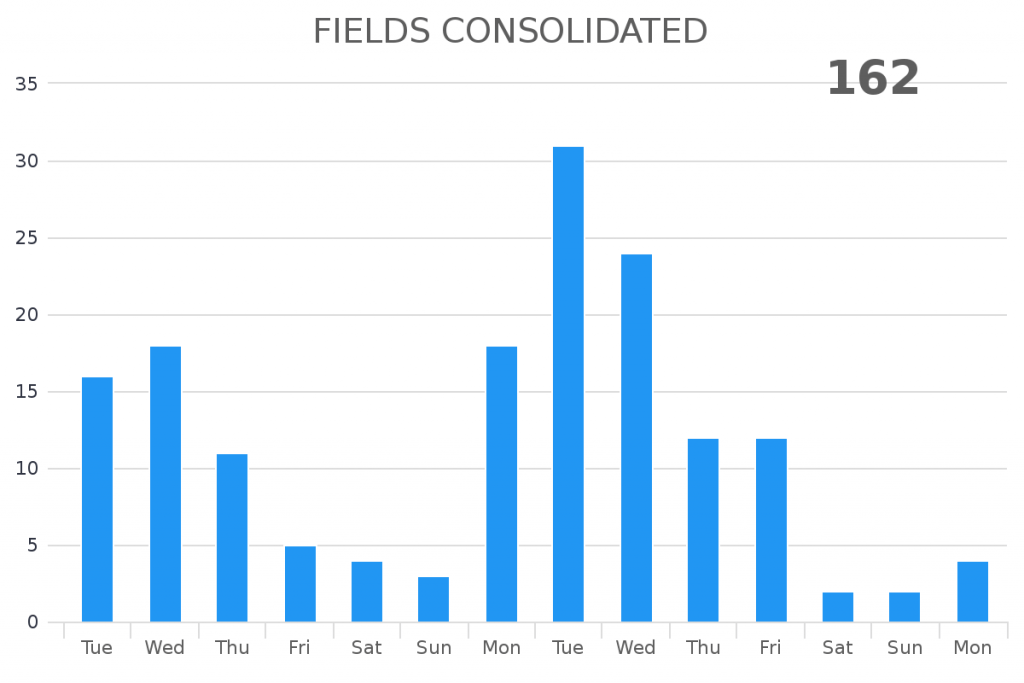
Fields Consolidated
See the number of contacts that were updated because of the field consolidator over a given date range.
Web Tracker Events
See the number of contacts that Graphly's Web Tracker set the lead source or address fields for you.
Transactional Lifetime Value
See the lifetime value at the very first transaction as well as at other transactions of your choosing.
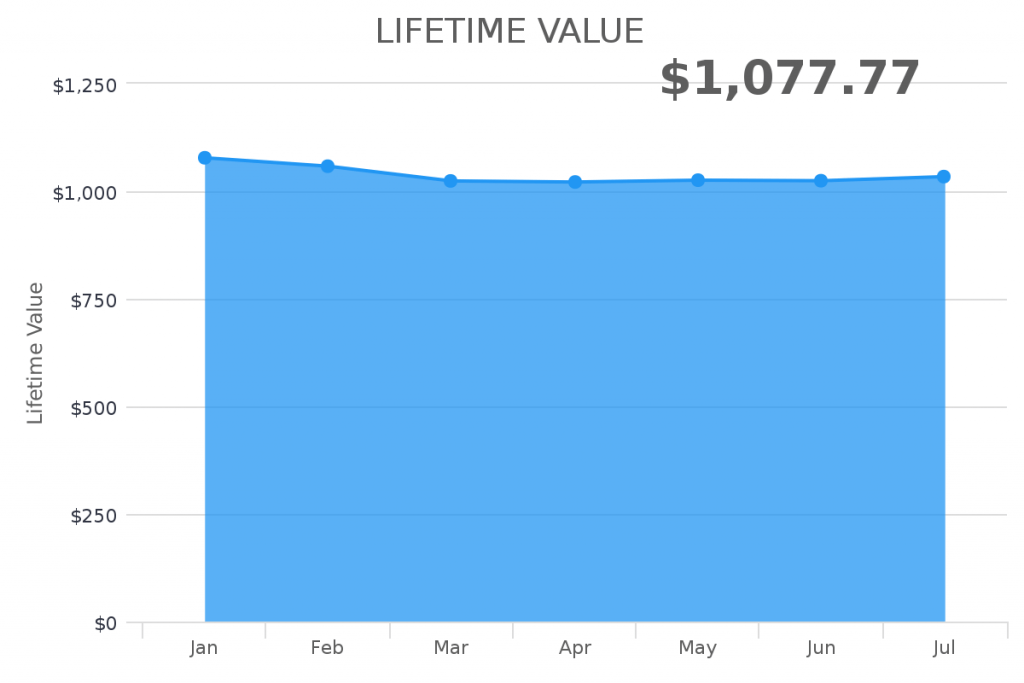
Lifetime Value
See the trend of the current lifetime value of your customers throughout a time frame you choose.
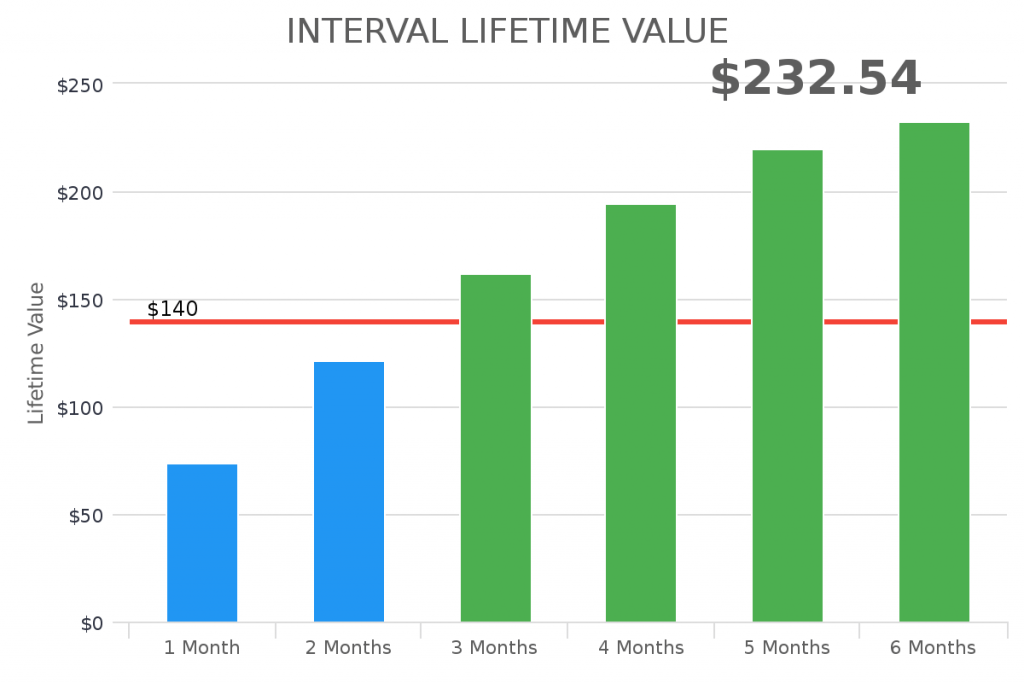
Interval Lifetime Value
See the lifetime value at various time intervals of your choosing throughout the customer life cycle.
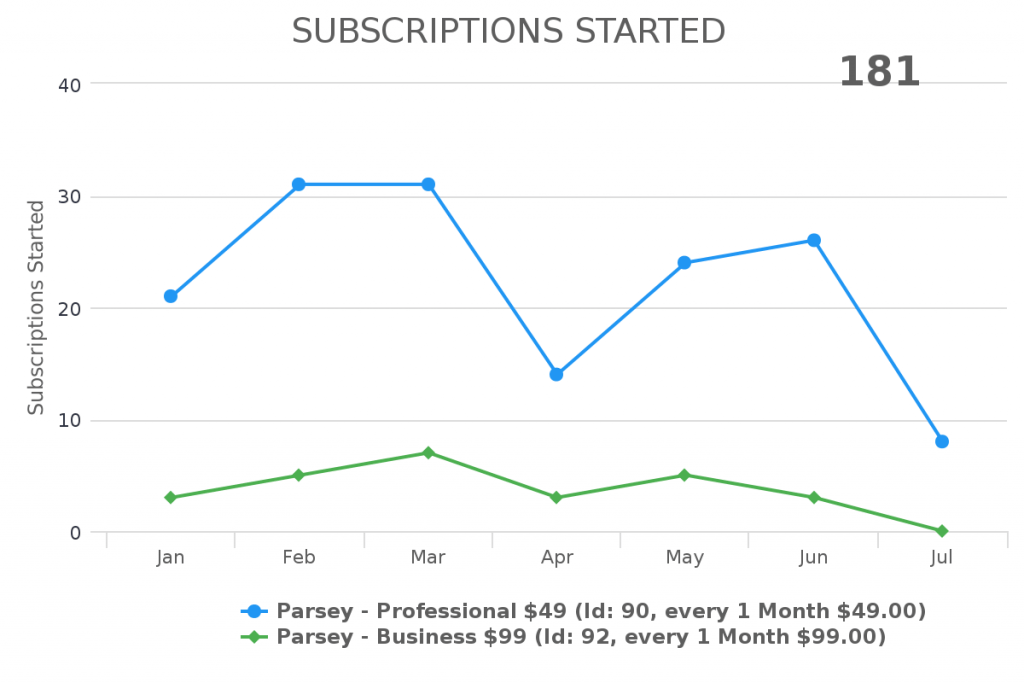
Subscriptions Started
See the number of subscriptions that have started over a given date range.
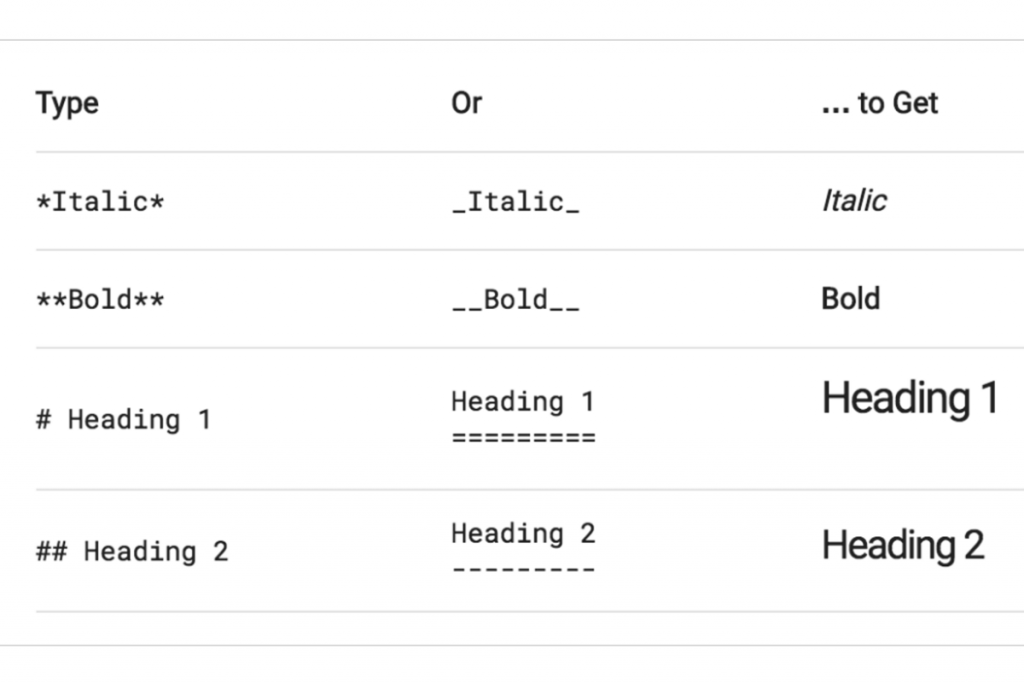
Text Area Widget
Add custom notes, messages, images, tables and more - anywhere on your dashboard.
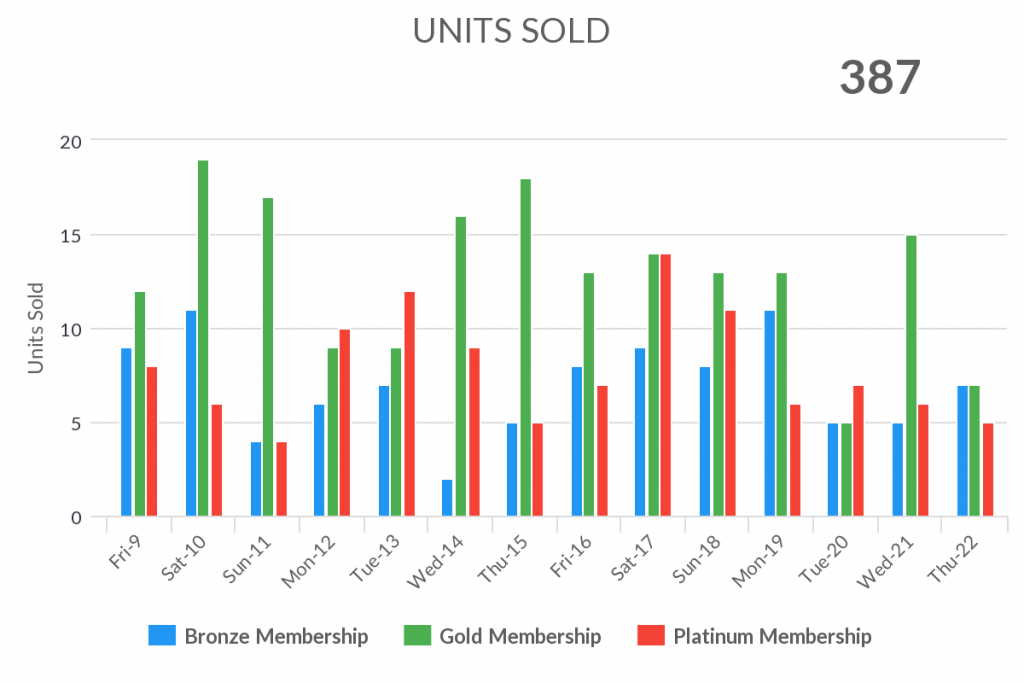
Units Sold
See the number of units sold for each product you select over a given date range.
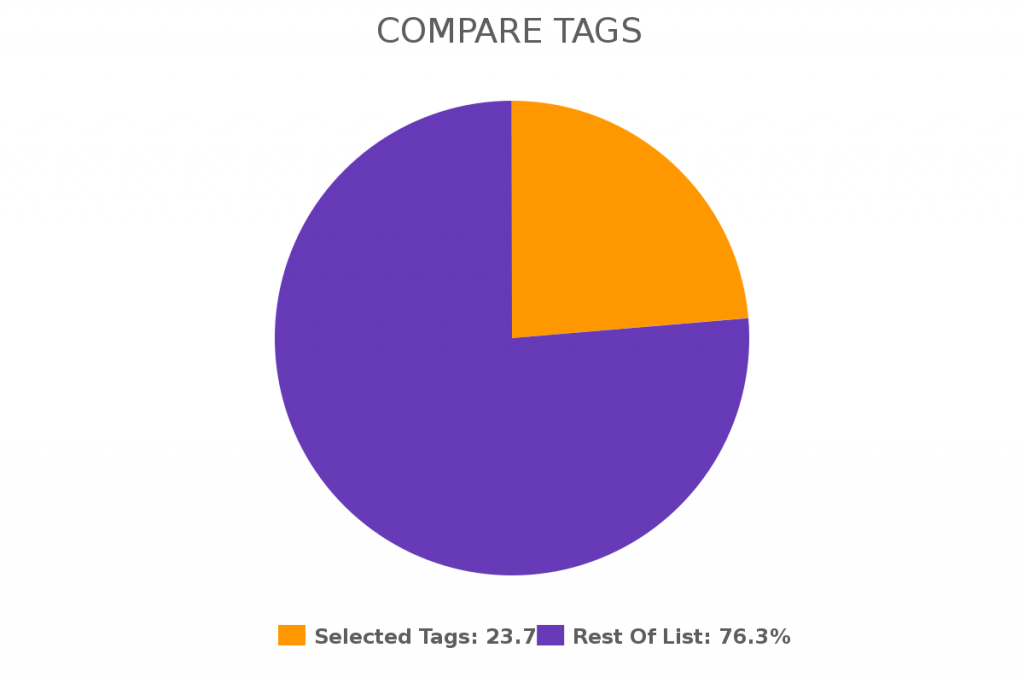
Compare Tags
Compare the number of contacts with tags to each other or to your entire list in a pie chart.
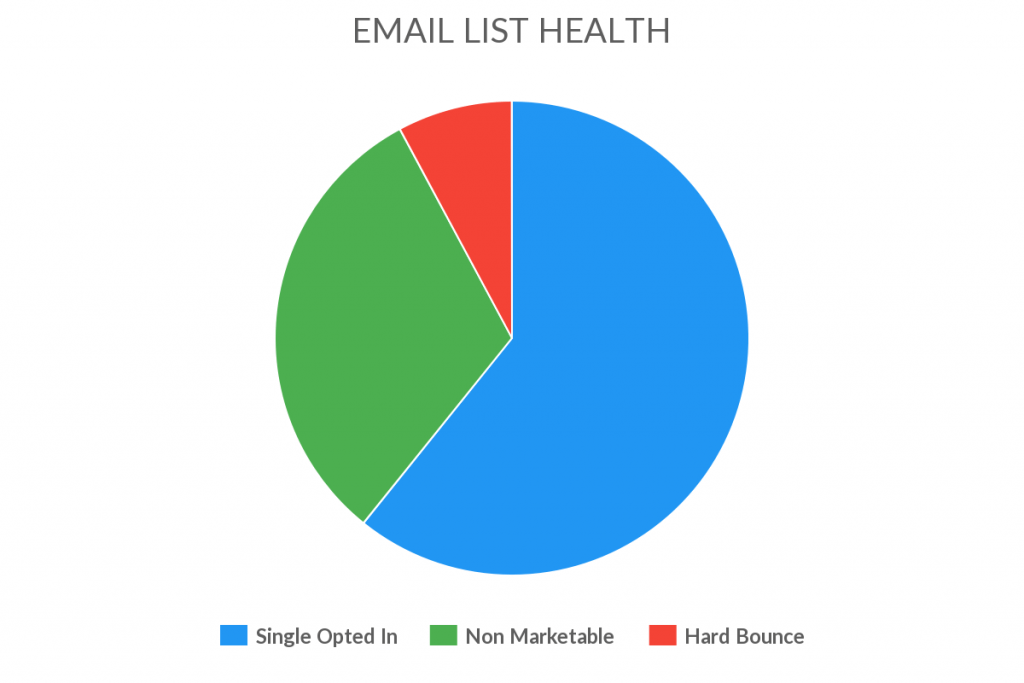
Email List Health
Shows a breakdown of the different email status for your email list.
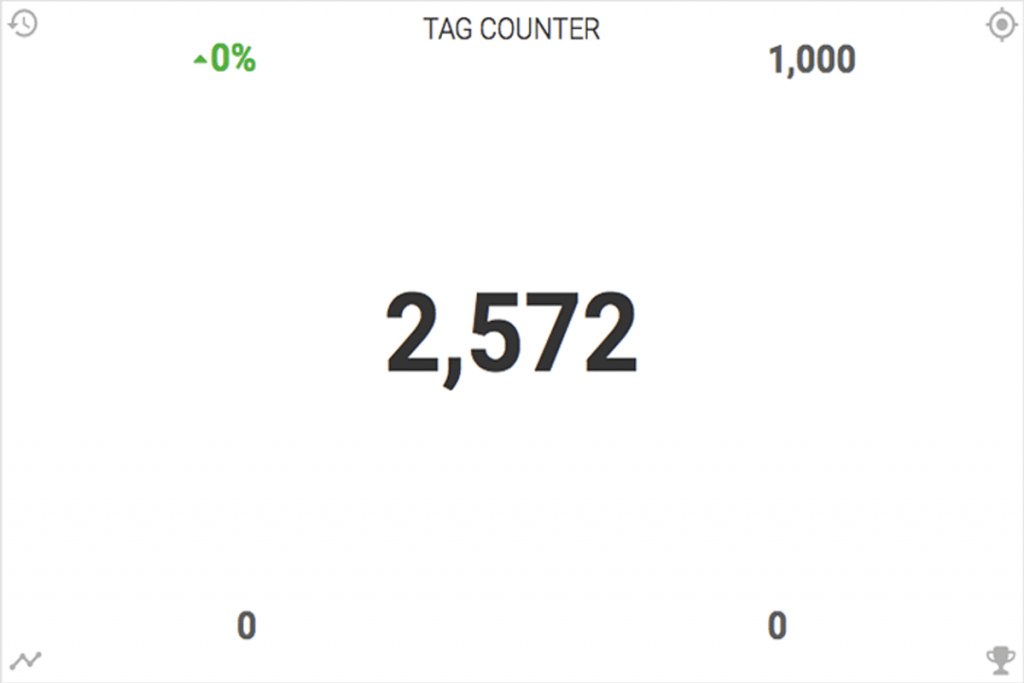
Tag Counter
Shows the current value, trend, goal, average and best with the ability to display the number of contacts with the selected tags.
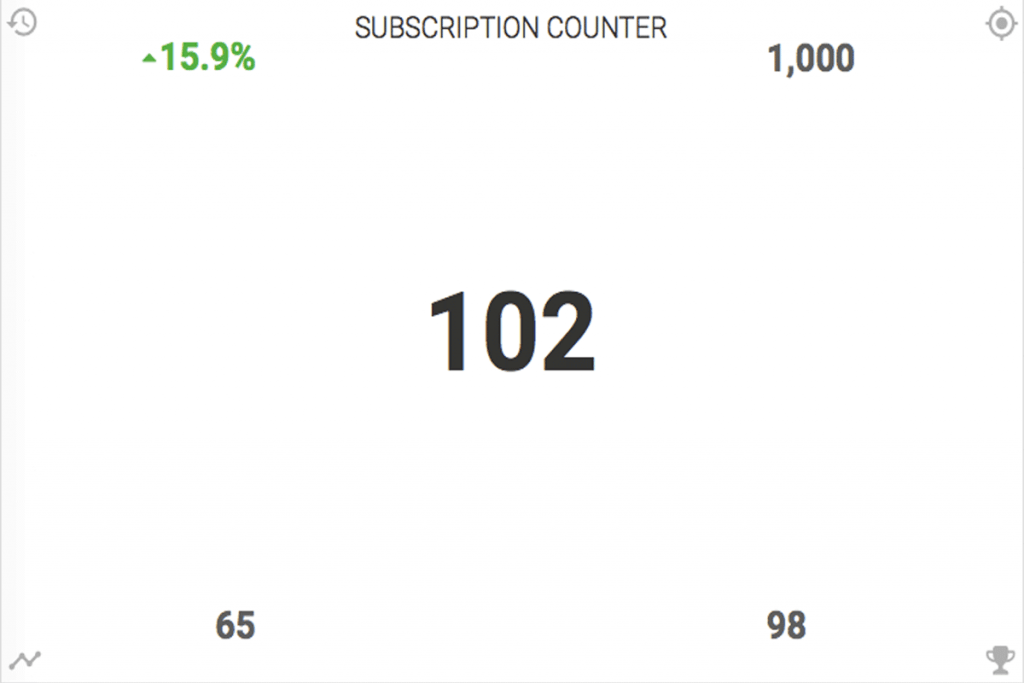
Subscription Counter
Shows the current value, trend, goal, average and best with the ability to display the count, sum, average, min or max (for subscription records).
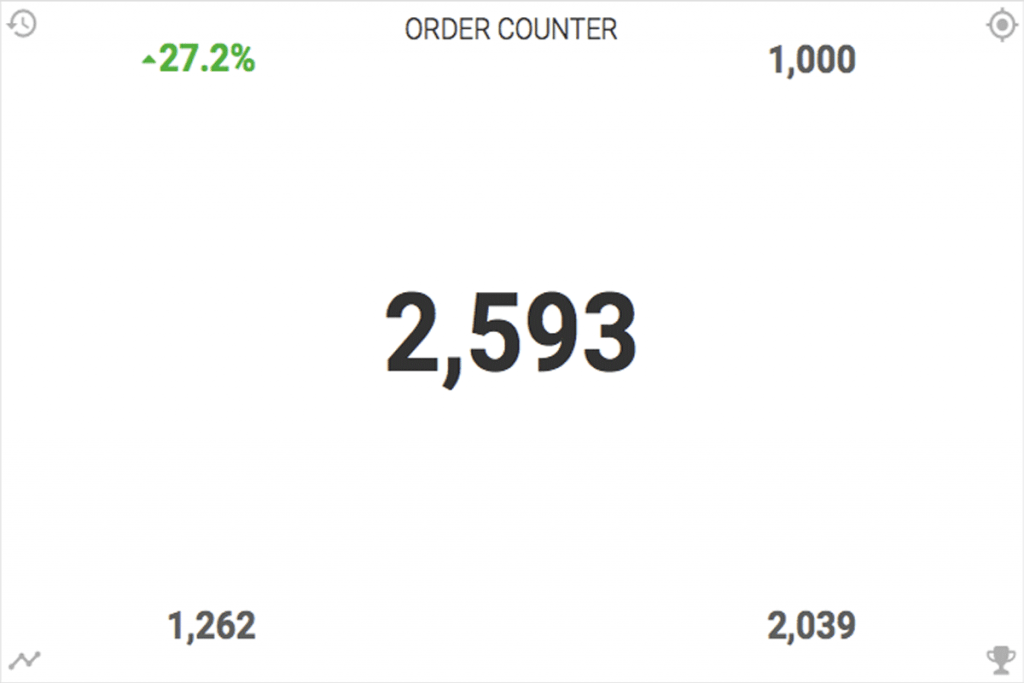
Order Counter
Shows the current value, trend, goal, average and best with the ability to display the count, sum, average, min or max (for order records).
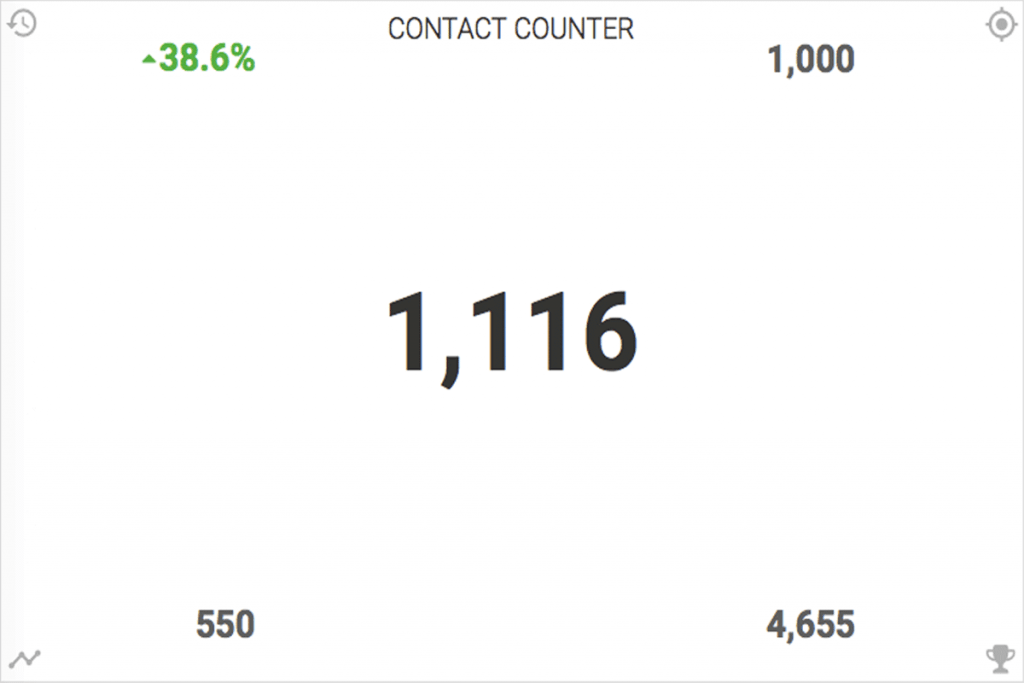
Contact Counter
Shows the current value, trend, goal, average and best with the ability to display the count, sum, average, min or max (for contact records).
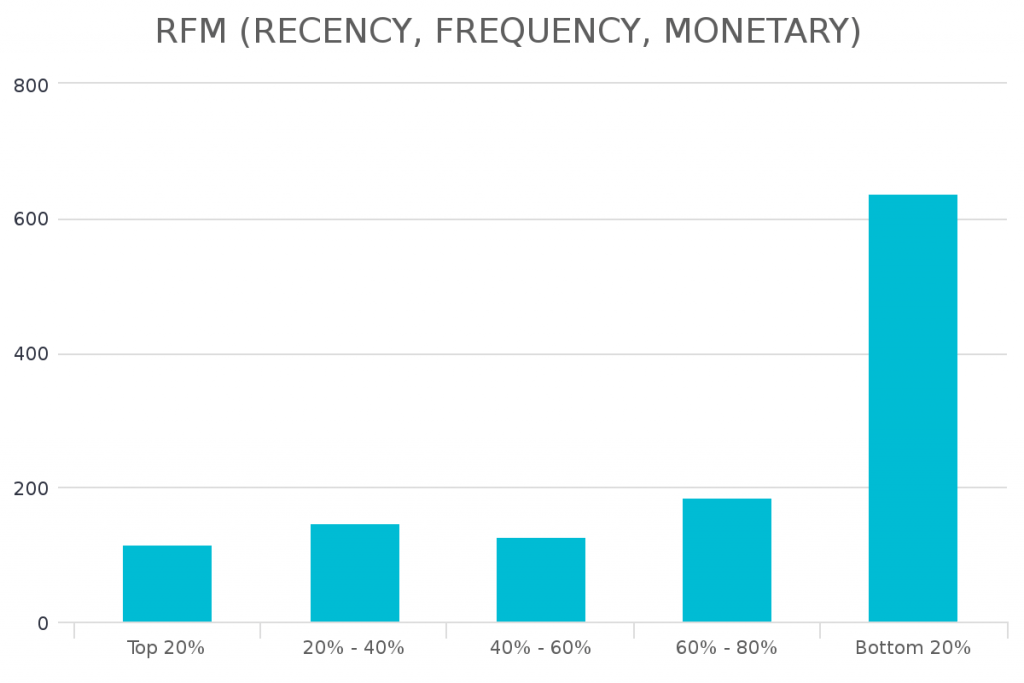
RFM (Recency, Frequency, Monetary)
Identify your best customers and discover the common lead sources and tags they share.
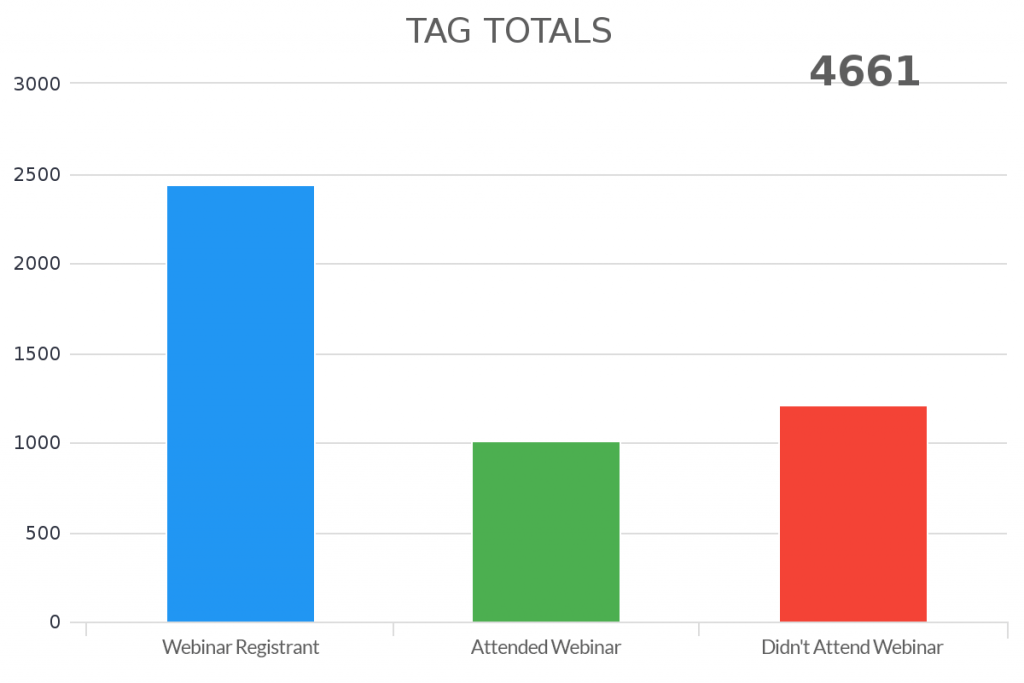
Tag Totals
Shows the total number of contacts with each selected tag. Can limit by date range.
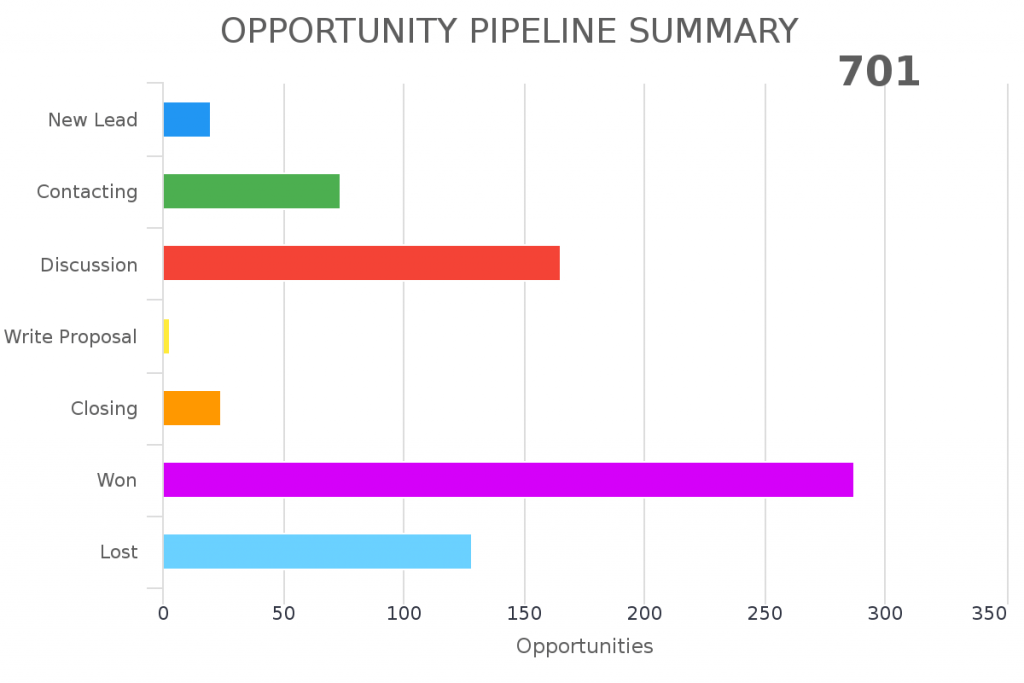
Opportunity Pipeline Summary
Shows a breakdown of the number or the revenue in each of your opportunity stages.
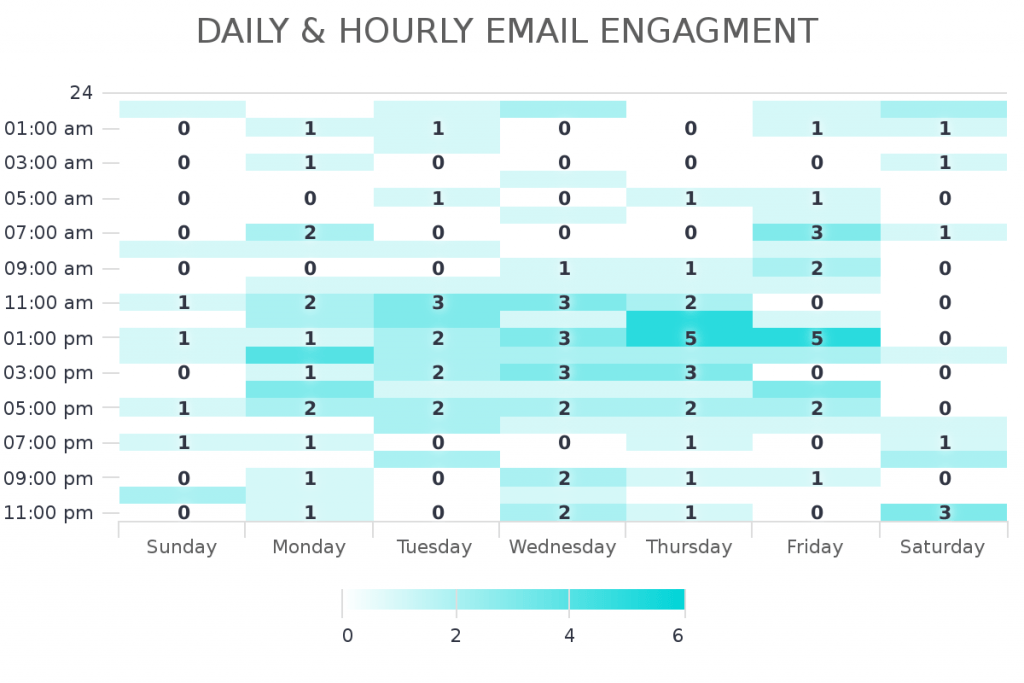
Daily & Hourly Email Engagement
Shows the best day and time to send emails.
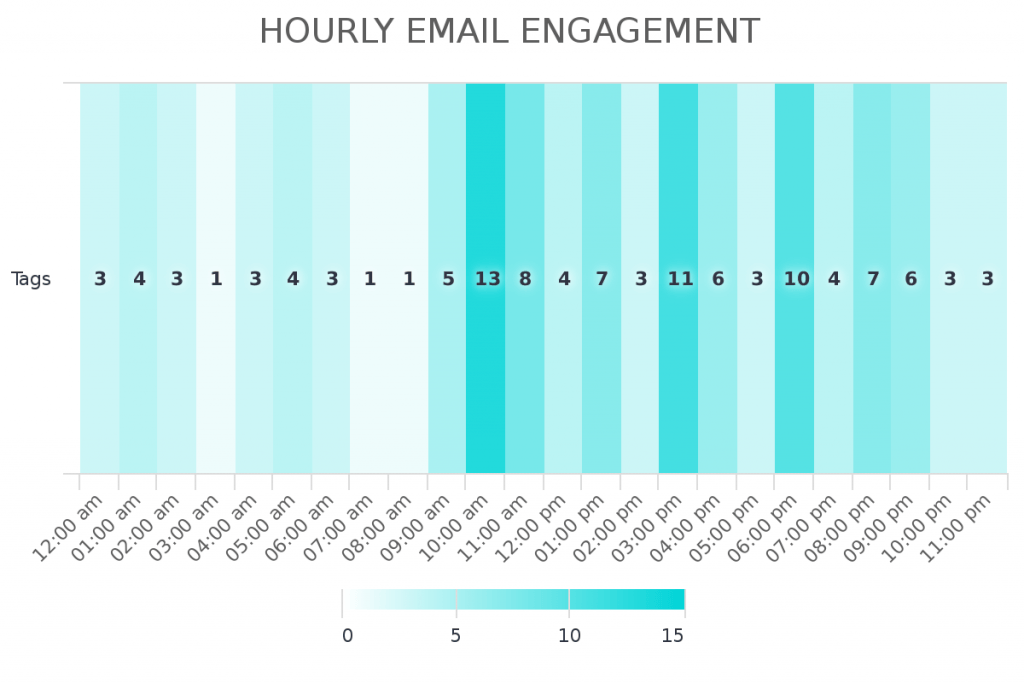
Hourly Email Engagement
Shows the best time of the day to send emails.
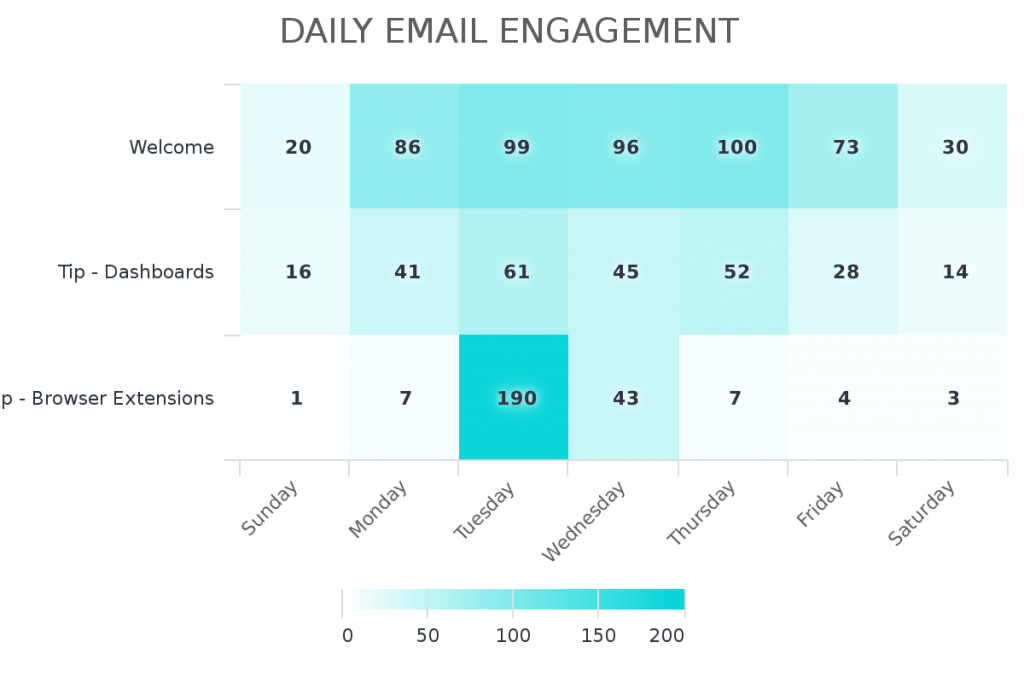
Daily Email Engagement
Shows the best days of the week to send emails.
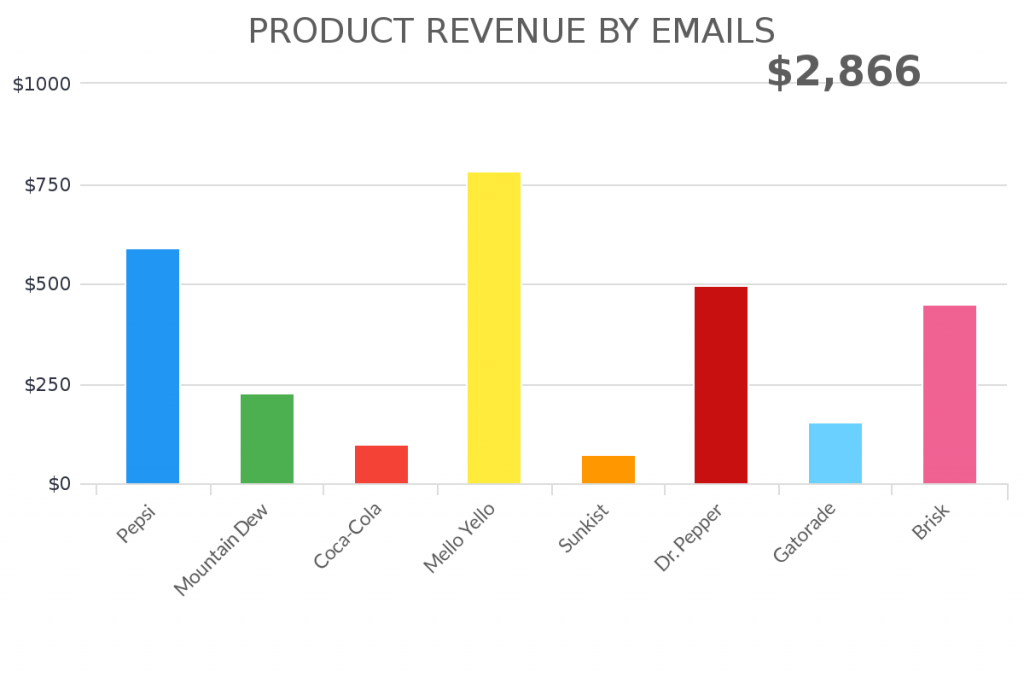
Product Revenue By Emails
Shows the product(s) revenue for the emails you’ve selected.
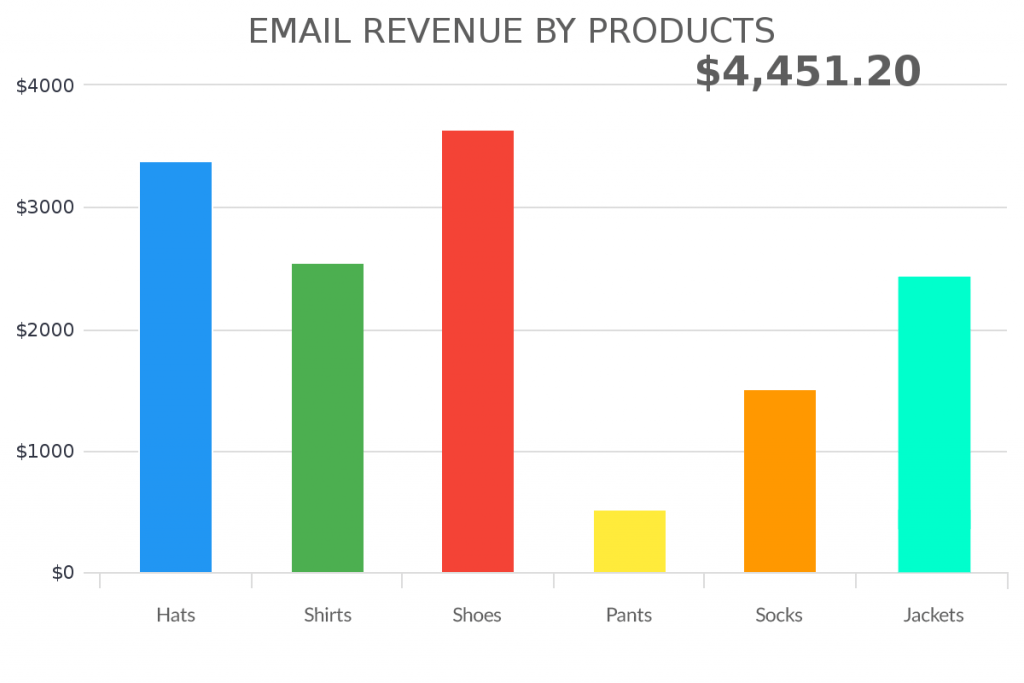
Email Revenue By Products
Shows the emails responsible (and revenue) for selling the products you’ve selected.
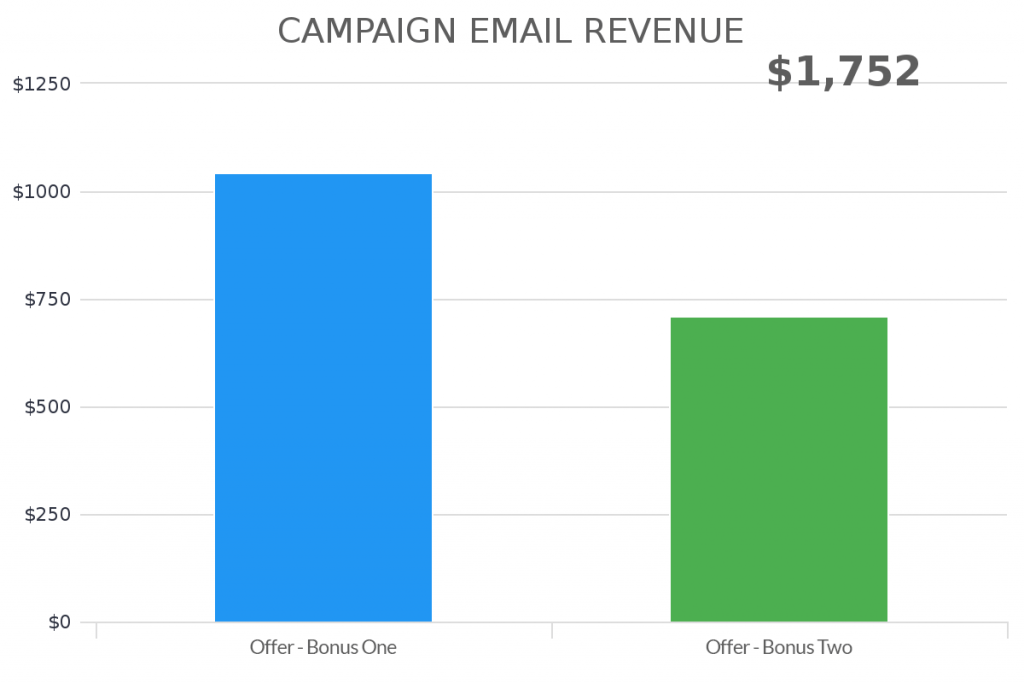
Campaign Email Revenue
Show the revenue generated by each email in a campaign sequence.
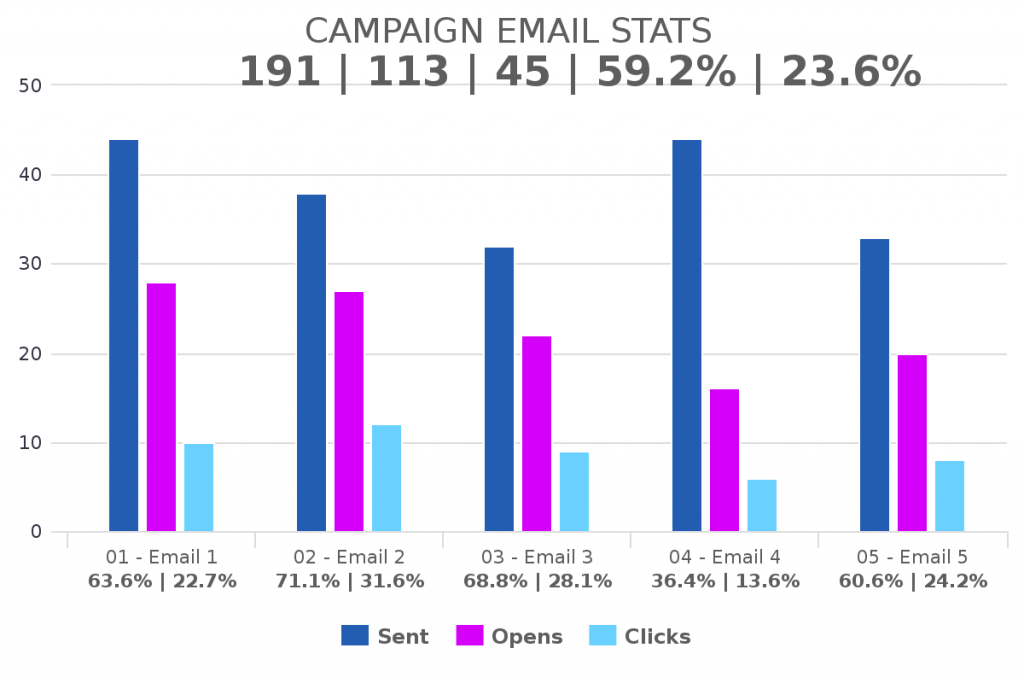
Campaign Email Stats
Show the opens, clicks, and conversions for each email in a campaign sequence.
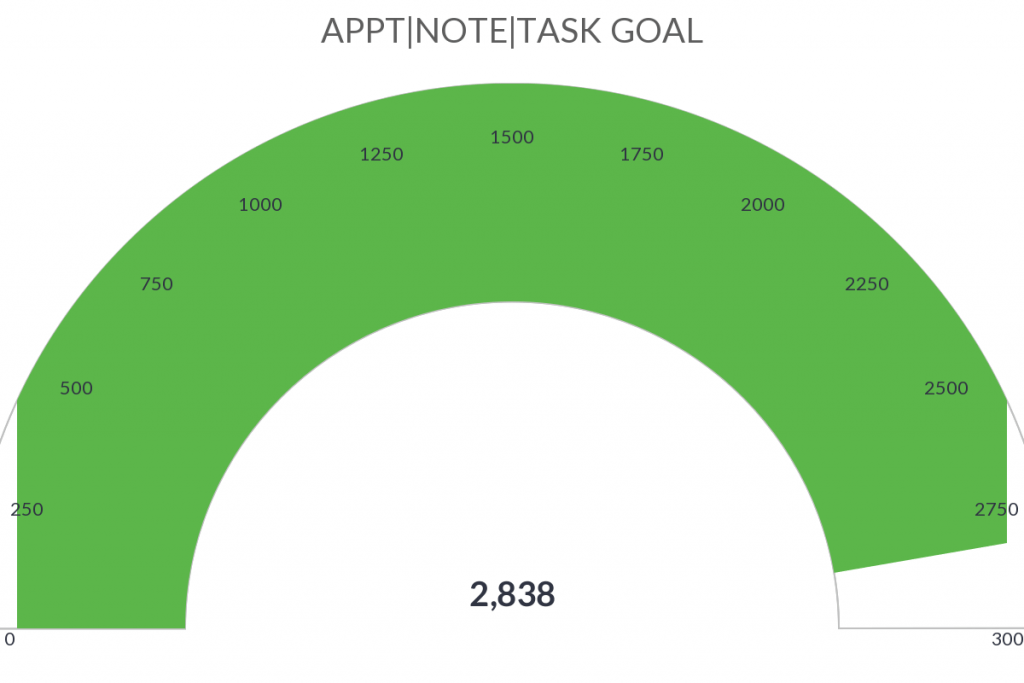
Appt|Note|Task Goal
Set a goal for appointments, notes, and tasks for you users and track progress towards it.
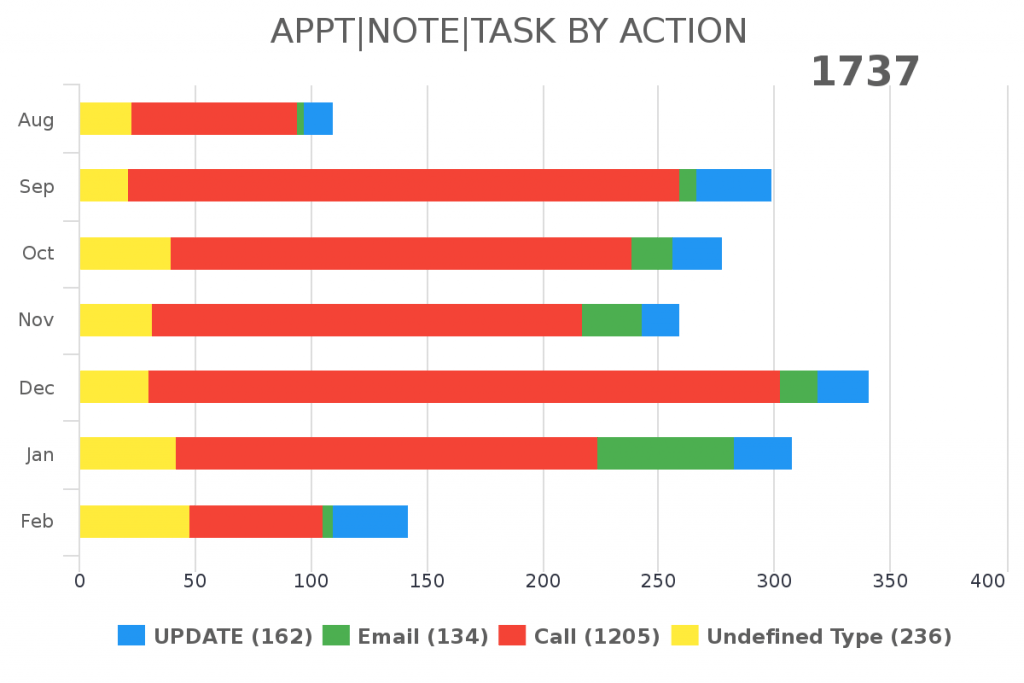
Appt|Note|Task By Action
Show the appointments, notes, and tasks for each Action Type to compare them to each other.
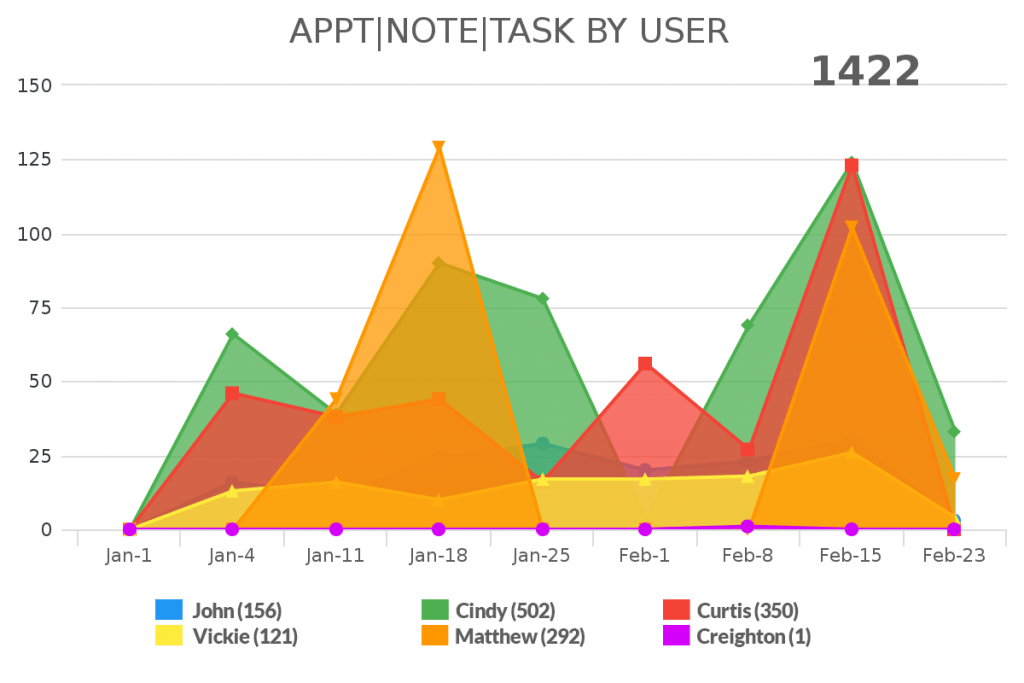
Appt|Note|Task by User
Show the appointment, notes, and tasks for each user to compare them to each other.
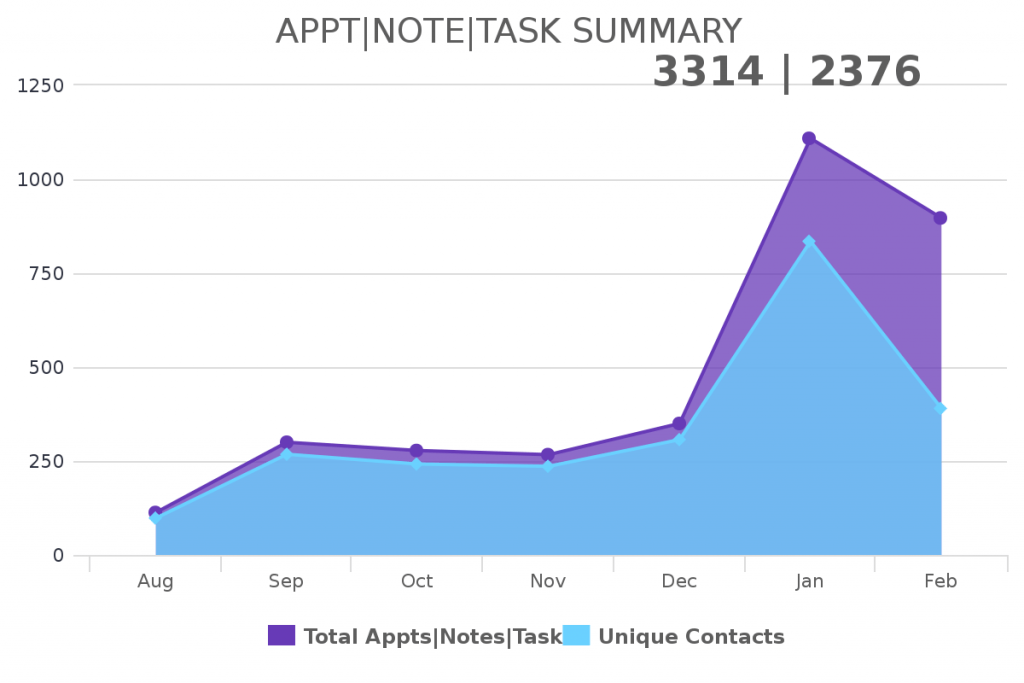
Appt|Note|Task Summary
Show the appointments, notes, and/or tasks summary that have been completed accrues a given date range.
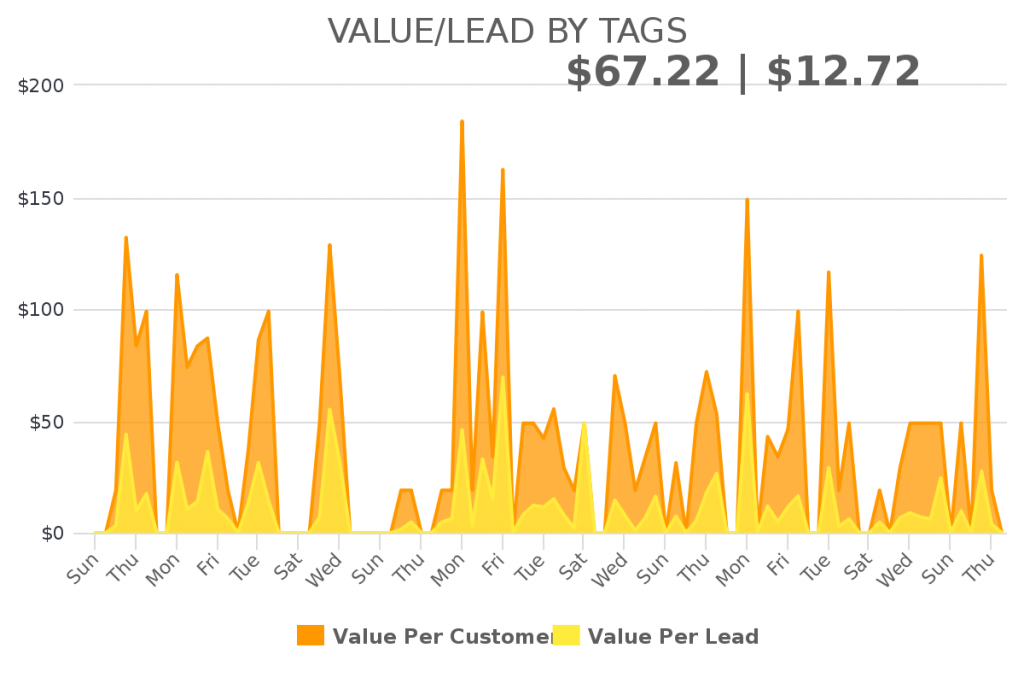
Value/Lead By Tags
Calculate the value that each lead and/or customer is worth based on a tag(s) getting applied. Set the time frame of how many days after the tags are applied to count revenue.
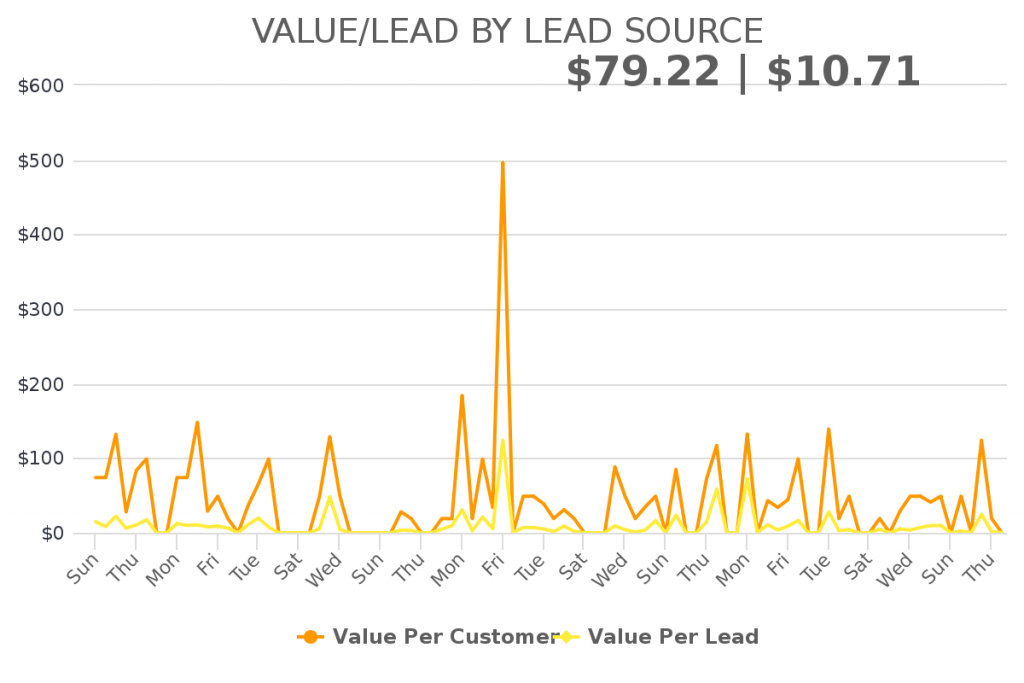
Value/Lead By Lead Source
Calculate the value that each lead and/or customer is worth based on the lead source(s). Set the time frame of how many days after a lead is created to count revenue.
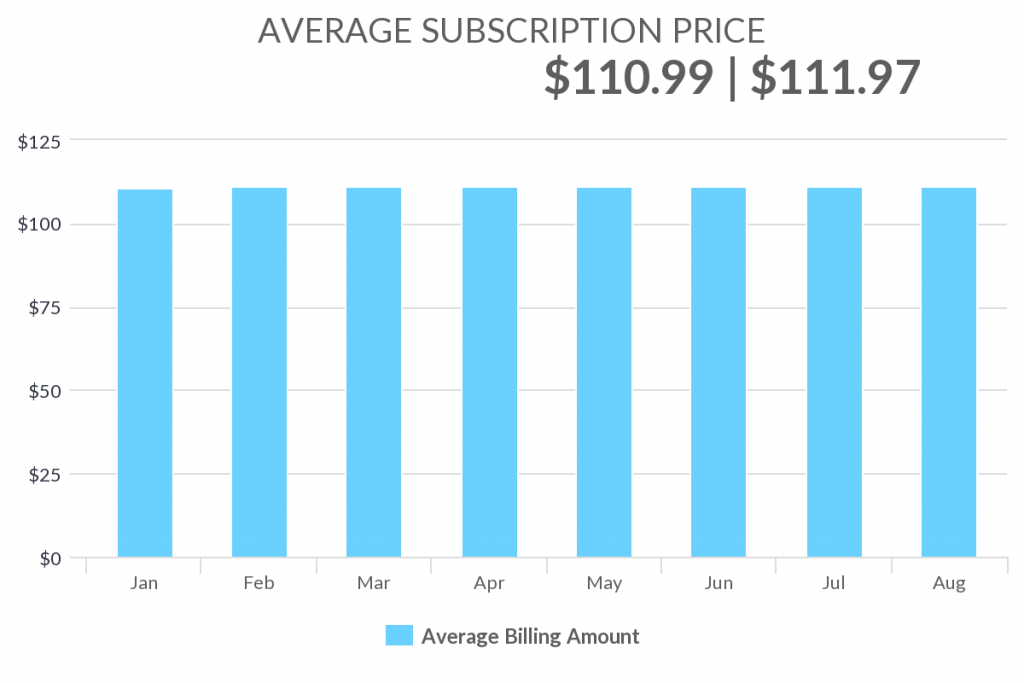
Average Subscription Price
Find the average billing amount of your selected subscriptions.
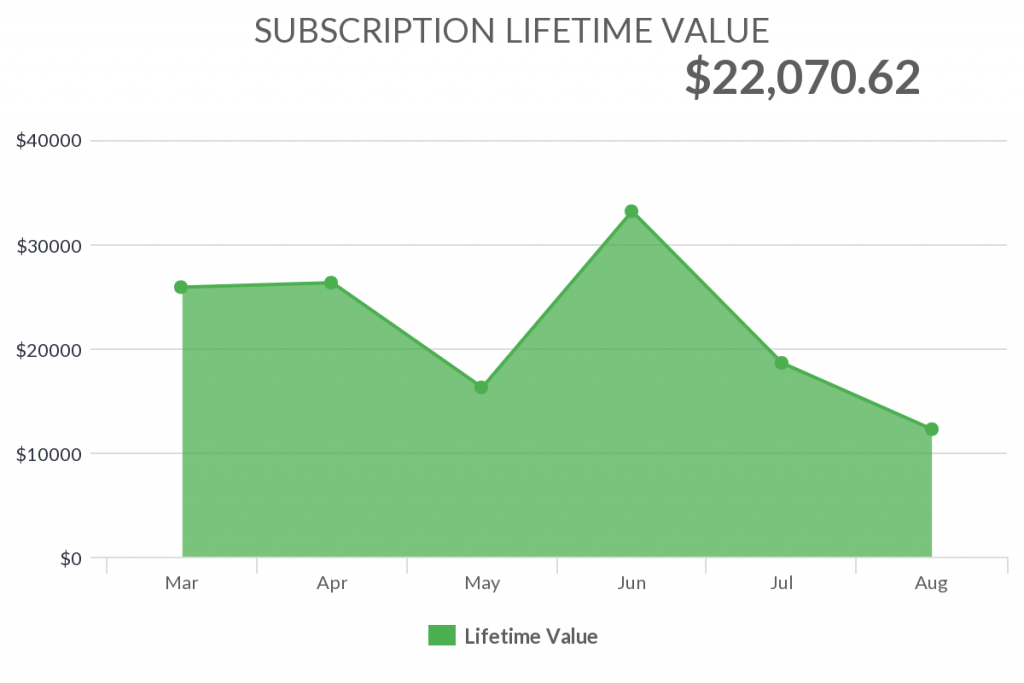
Subscription Lifetime Value
Shows the Lifetime Value of your customers for your selected subscriptions.
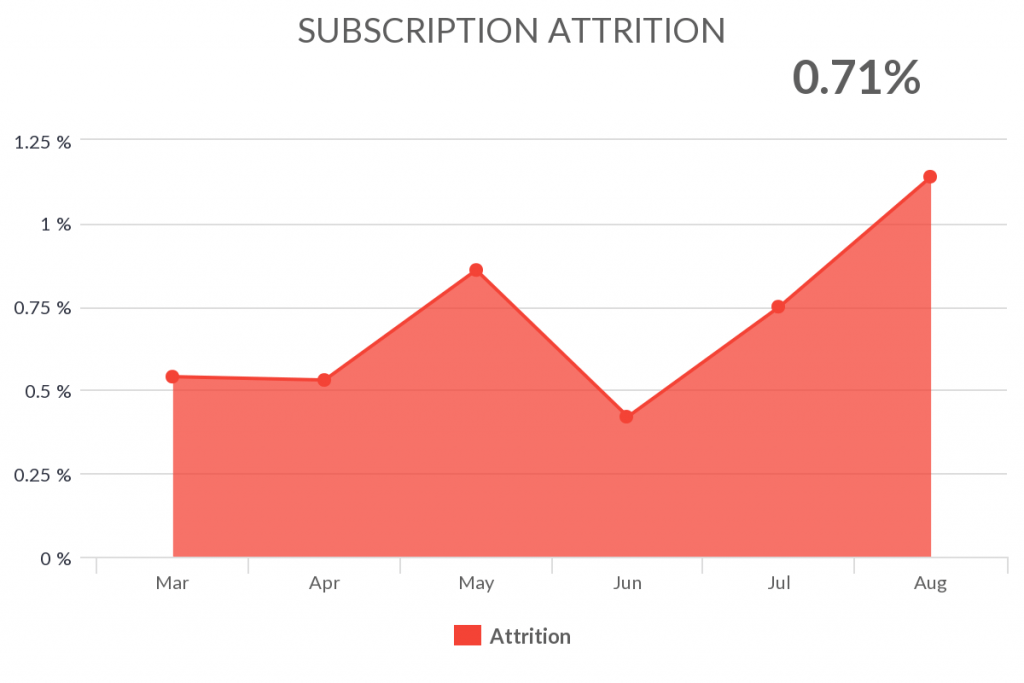
Subscription Attrition
Show the attrition rate over a period of time. Attrition is calculated by the number of cancelled subscriptions divided by the active subscriptions within the same time frame.
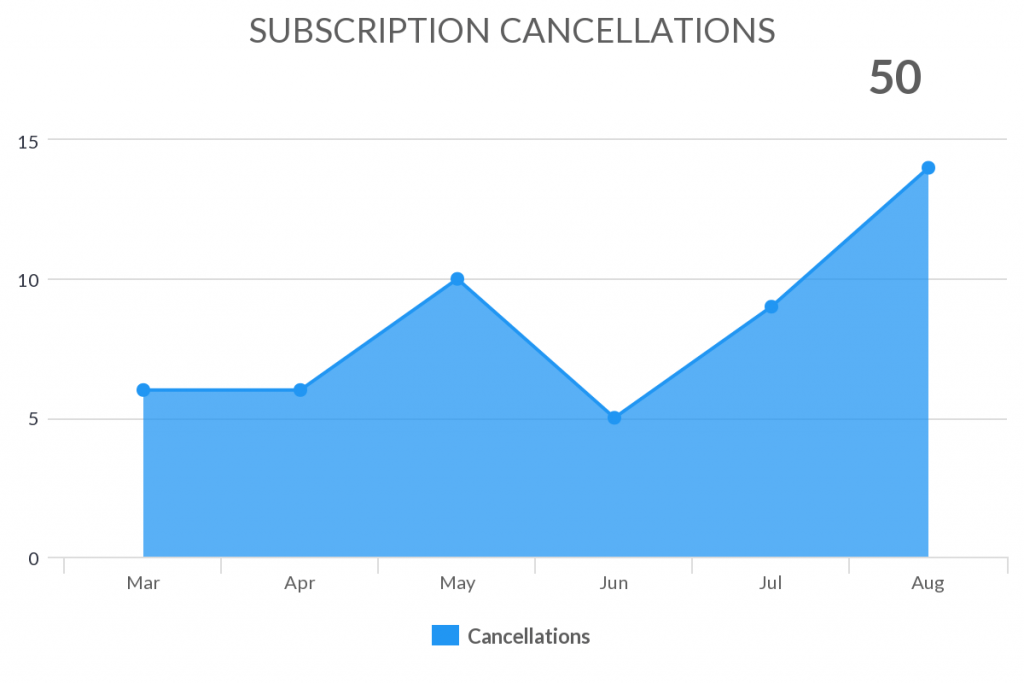
Subscription Cancellations
Show the number of subscriptions that are cancelled or inactivated during a given time frame.
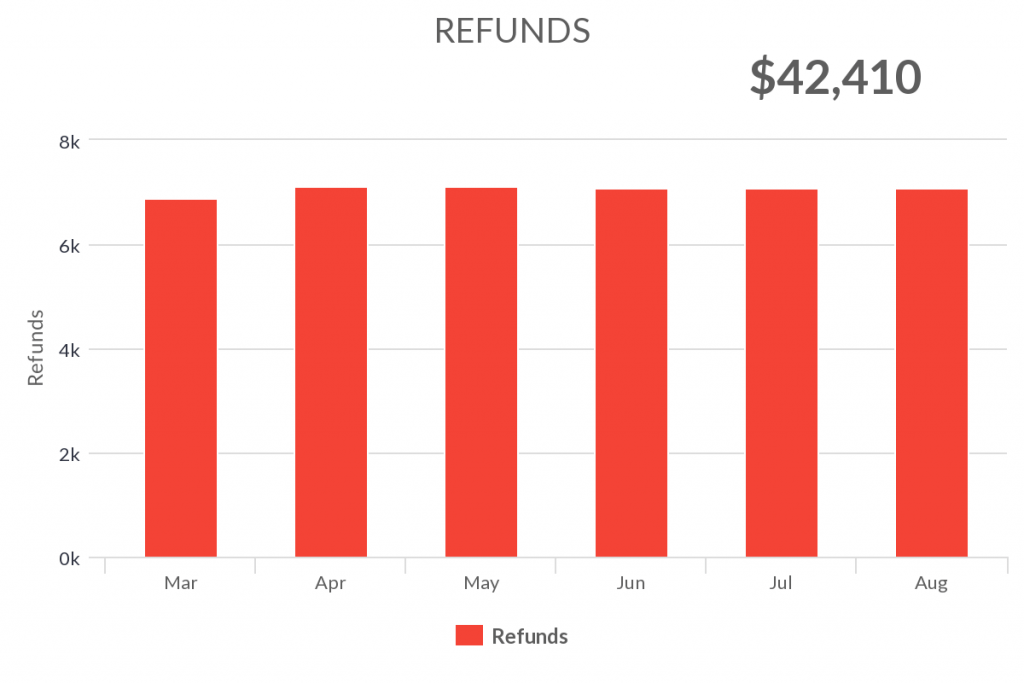
Refunds
Show the amount of refunds that are processed in a given time frame.

Payments Goal
Set a goal for the payments you want to collect.
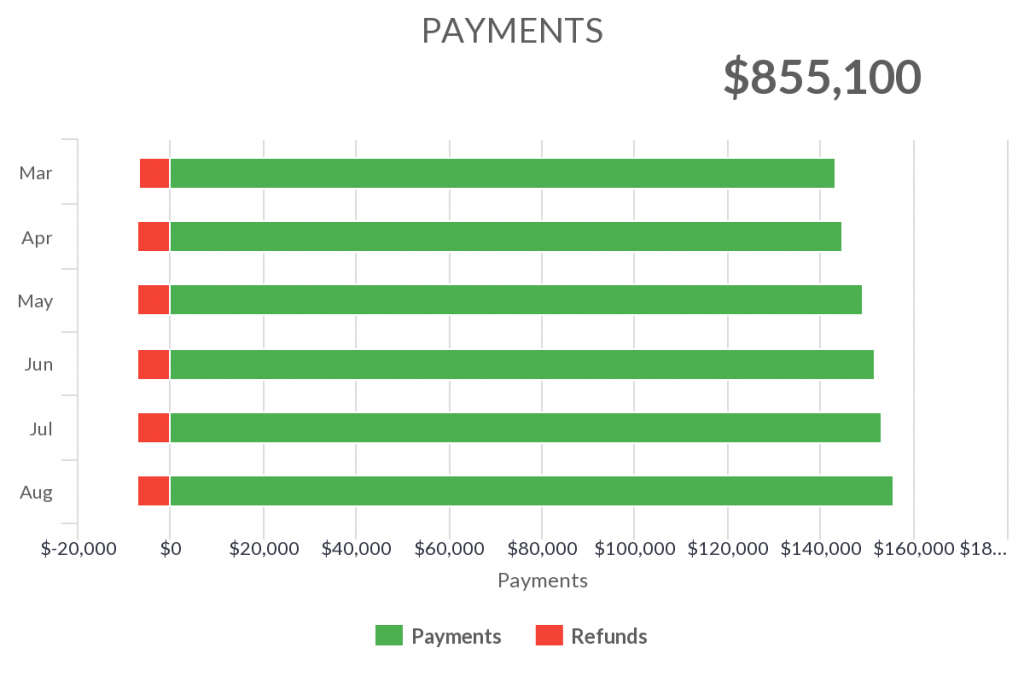
Payments
Display all your payments to view the amount of money you actually have collected during a time frame.
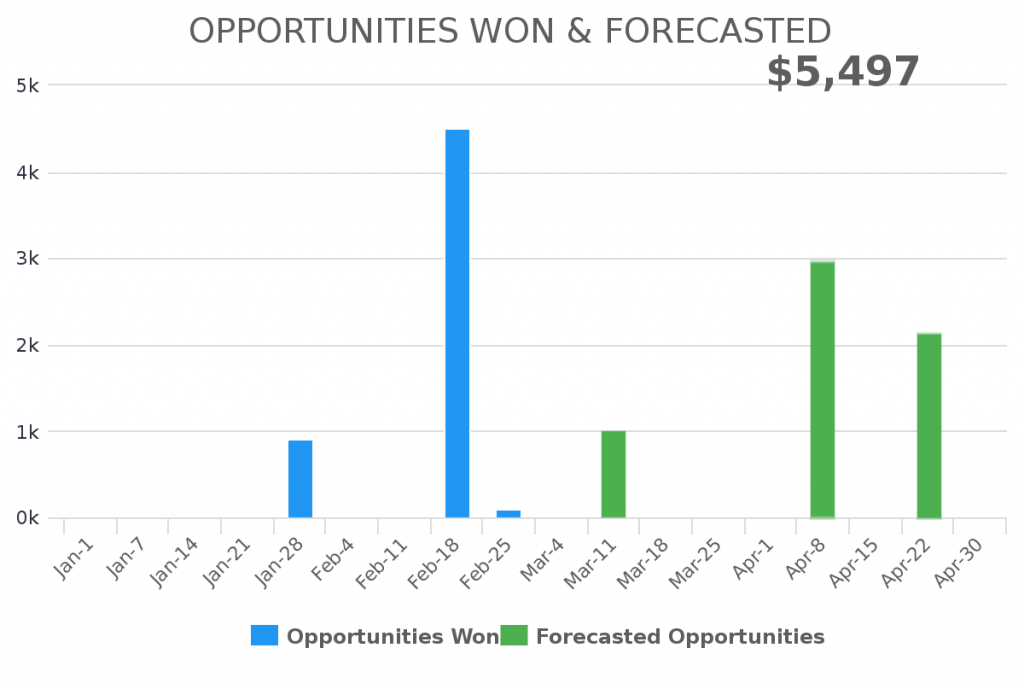
Opportunities Won & Forecasted
Displays the revenue from your WON opportunities and forecasts the revenue from your OPEN opportunities.
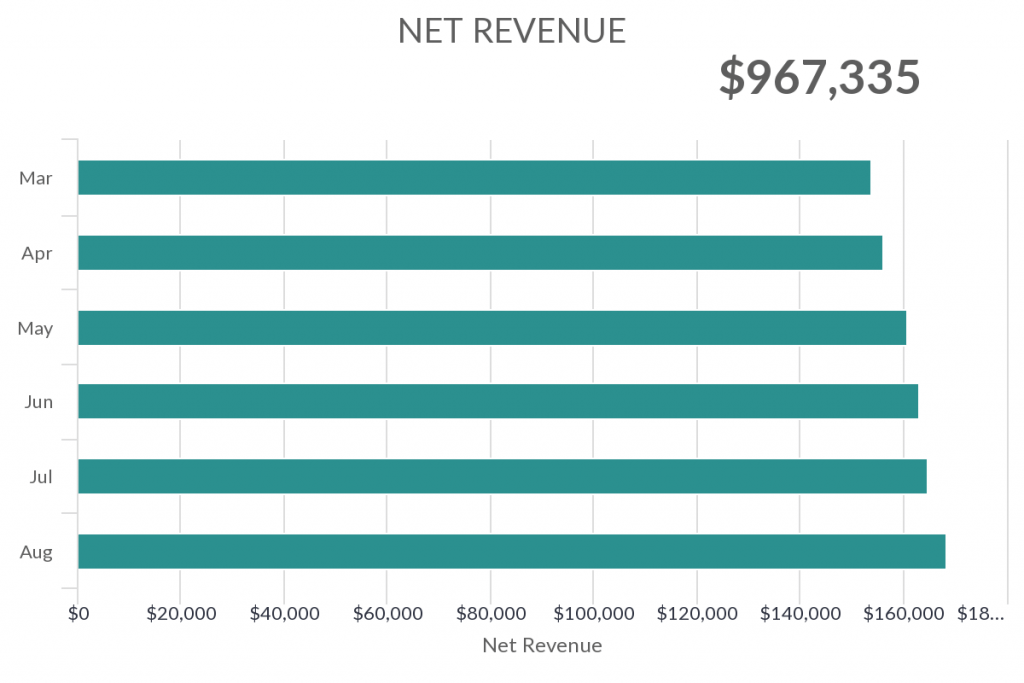
Net Revenue
Display the revenue from invoices subtracting all shipping, tax, and cost of good.
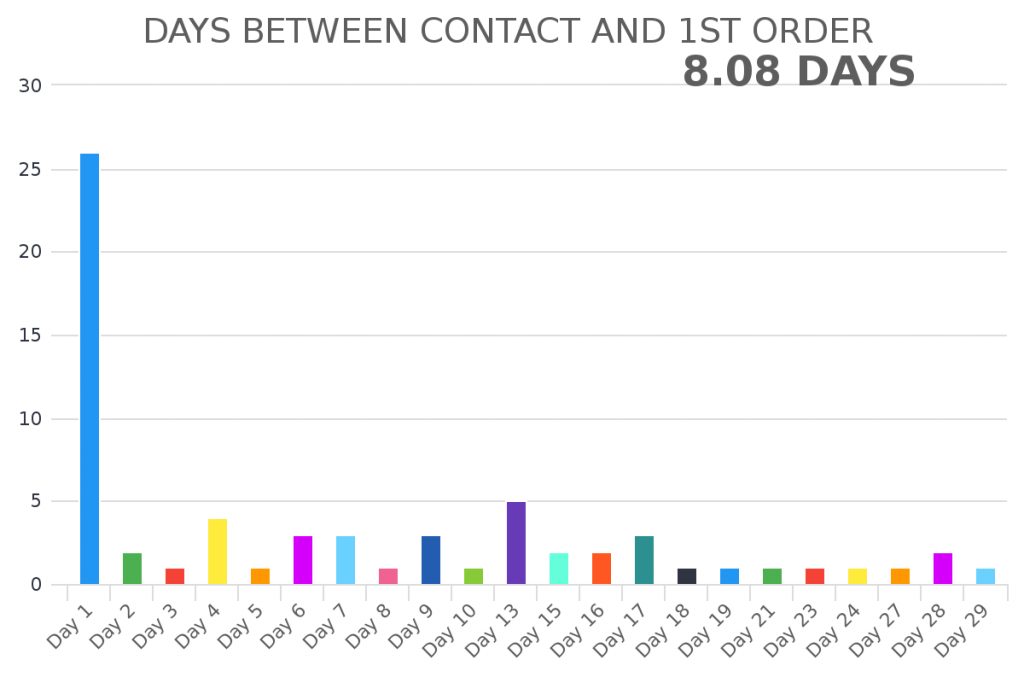
Days Between Contact and 1st Order
Calculate the number of days it takes from a contact being created to its 1st order.
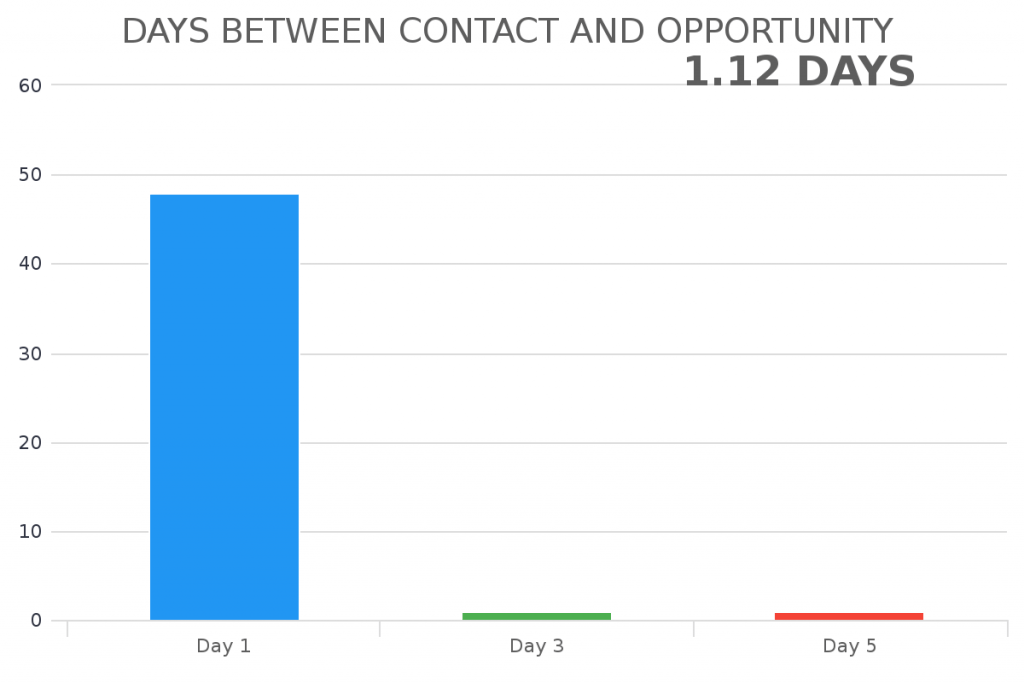
Days Between Contact & Opportunity
Calculate the days between when a contact was created and when the first opportunity was created for the contact.
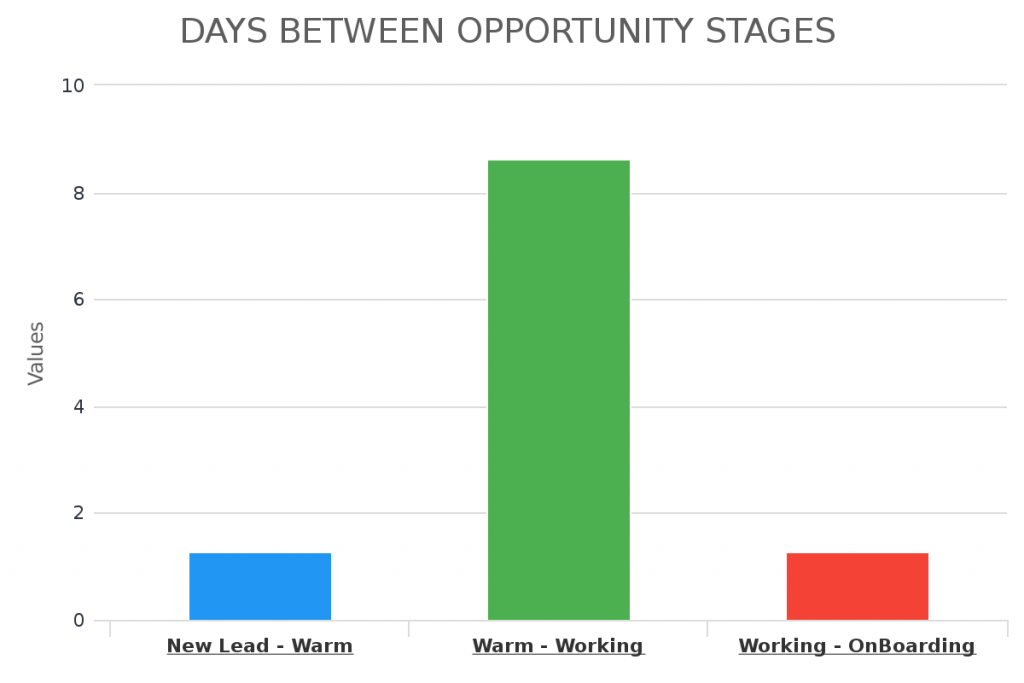
Days Between Opportunity Stages
Calculate the number of days it takes for opportunities to move between stages.
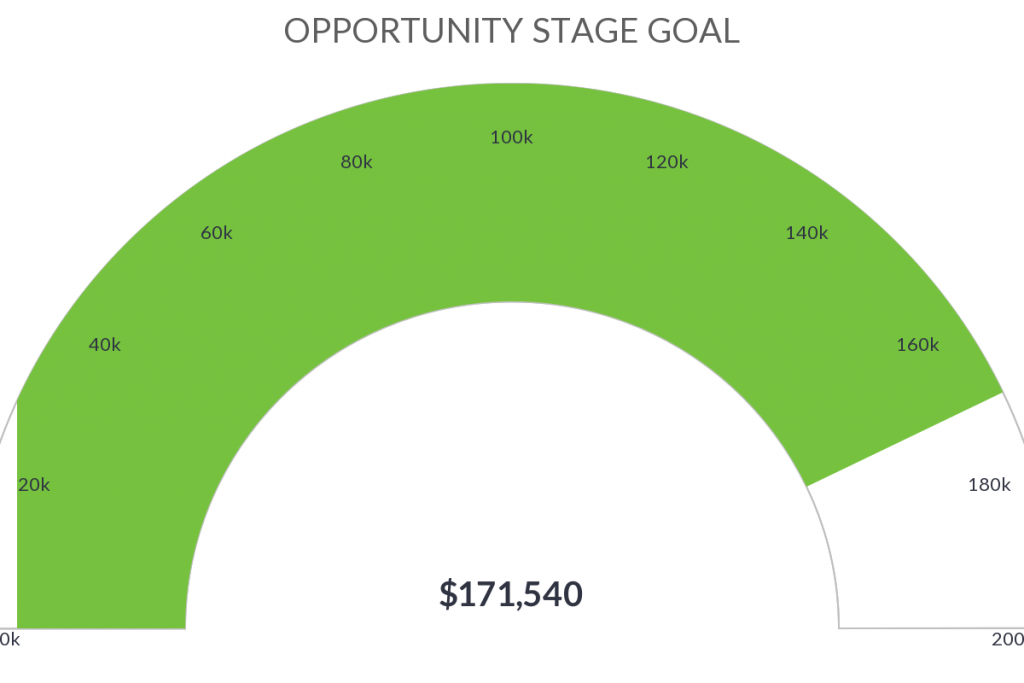
Opportunity Stage Goal
See what your pipeline revenue is based on selected stages.
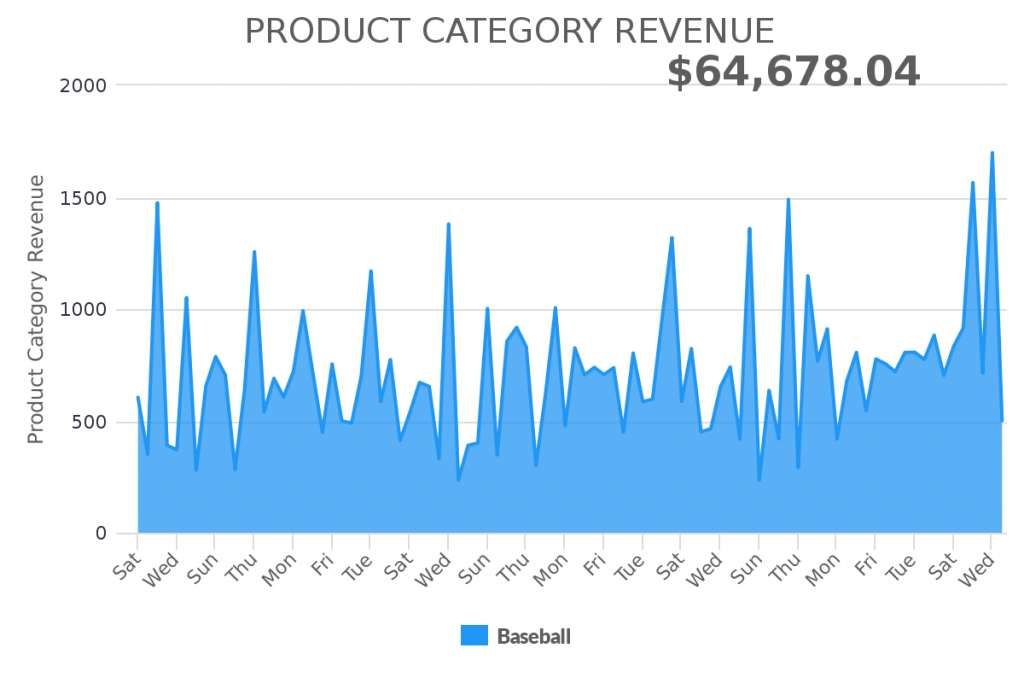
Product Category Revenue
See the product categories revenue over a period of time.
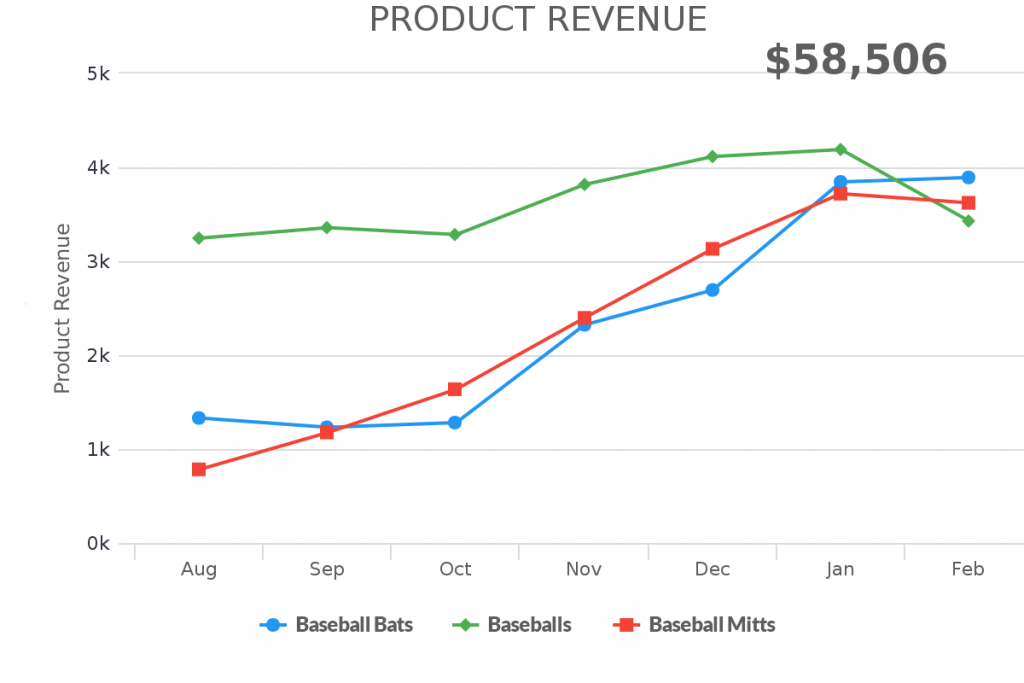
Product Revenue
See the products revenue over a period of time.
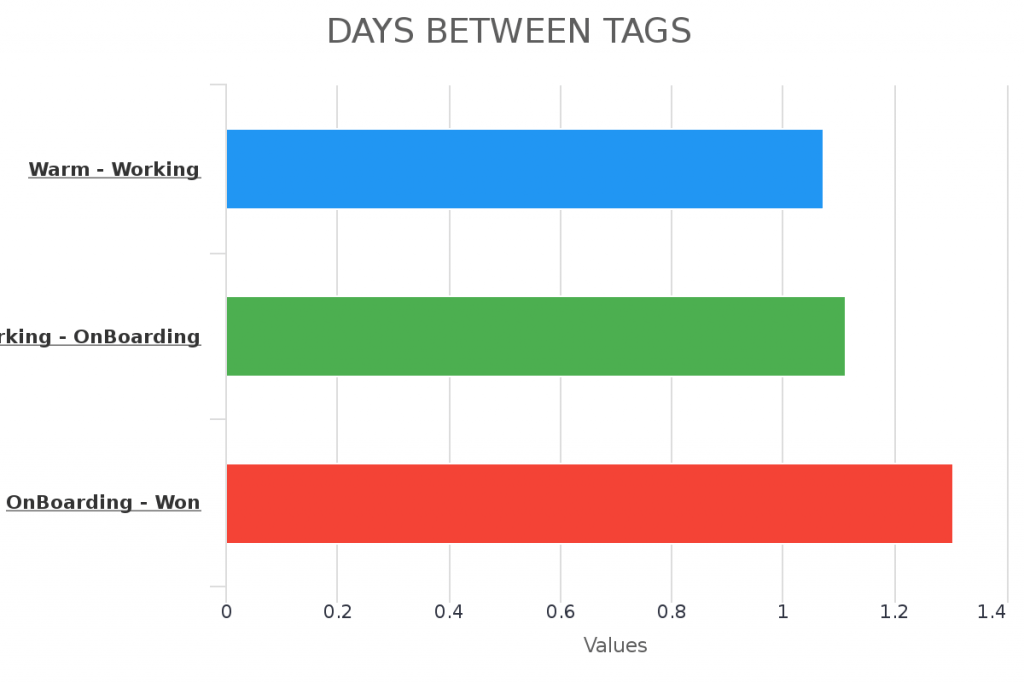
Days Between Tags
Calculate the number of days between when tags get applied. Show average as well as break down and see the details.
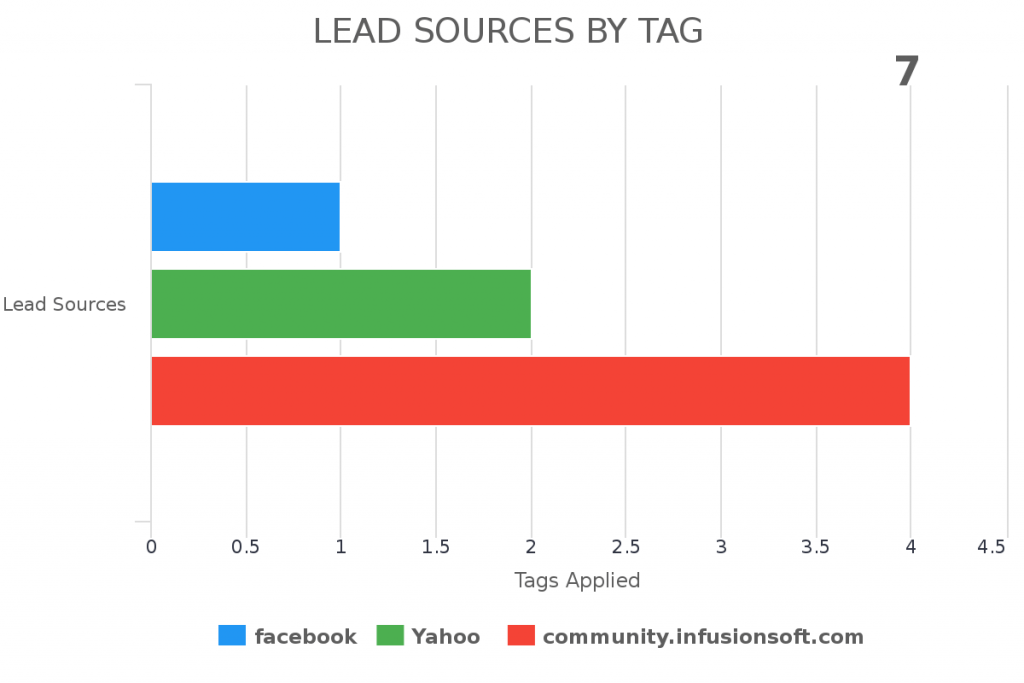
Lead Sources By Tag
Show the lead sources that attributed to the selected tag getting applied.
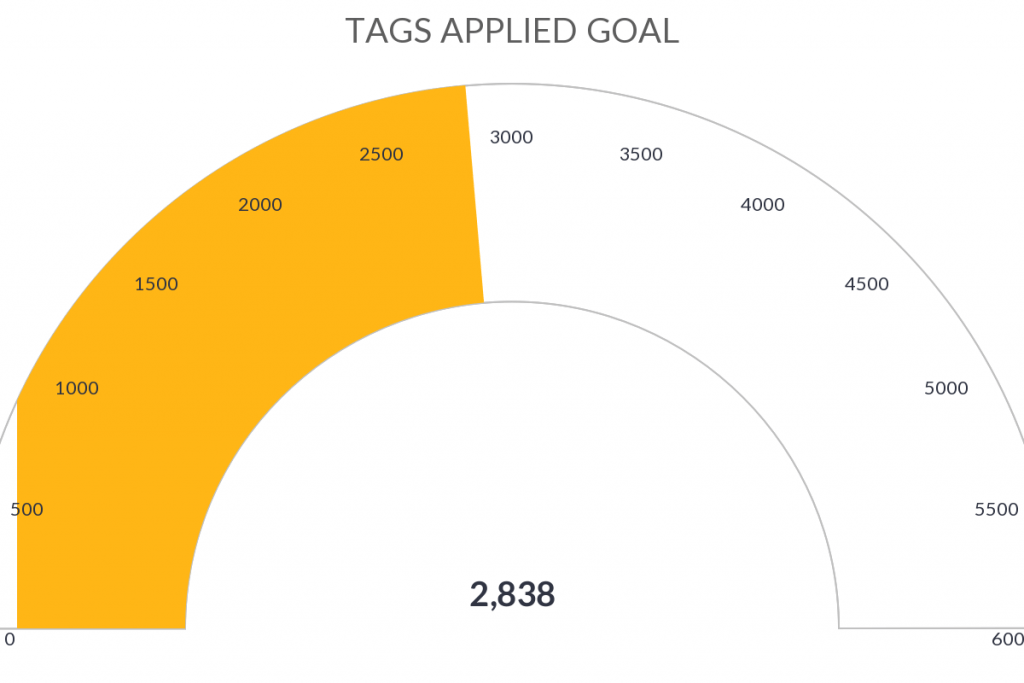
Tags Applied Goal
Set a goal of how many tags get applied during a certain period of time and track your progress towards it.
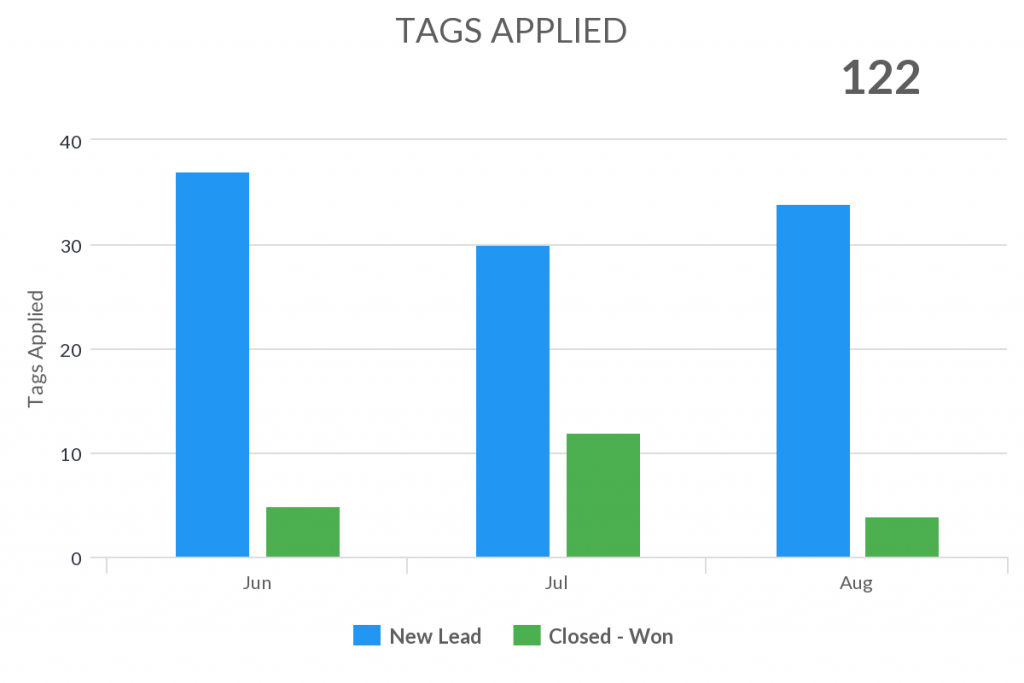
Tags Applied
See how many tags get applied to contacts during a period of time.
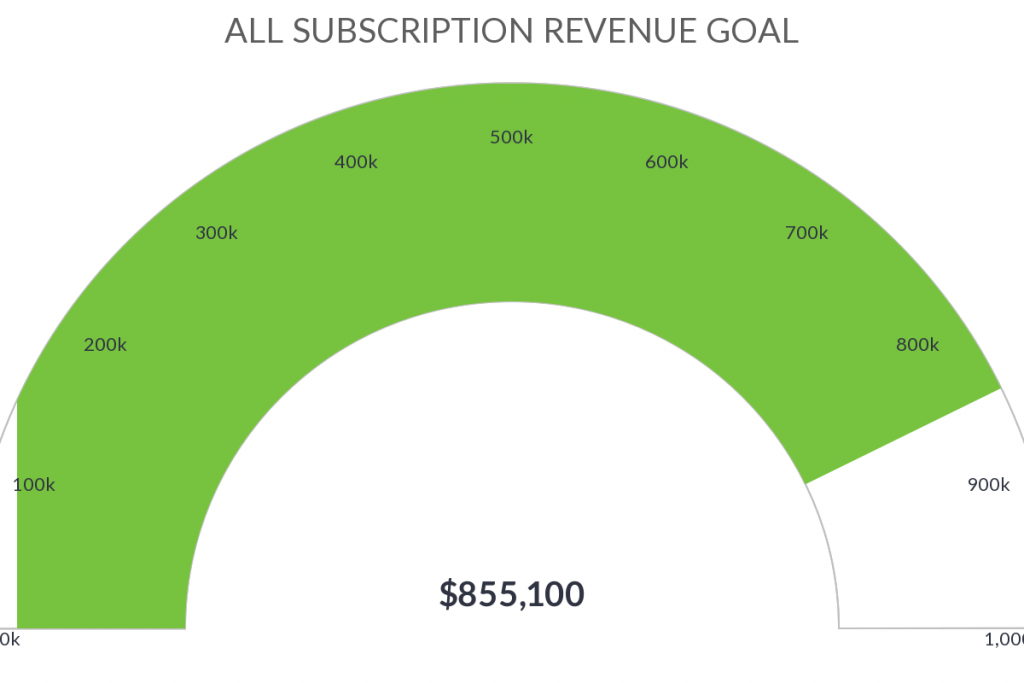
All Subscriptions Revenue Goal
Set a goal for all subscriptions revenue and track progress towards it.
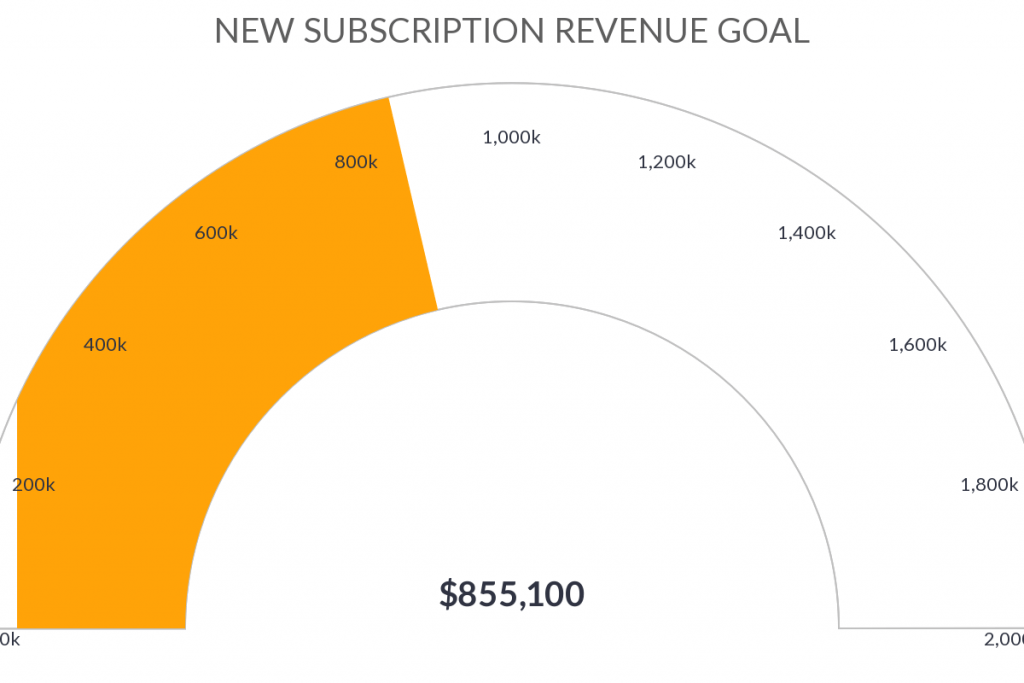
New Subscription Revenue Goal
Set a goal the new subscriptions revenue and track progress towards it.
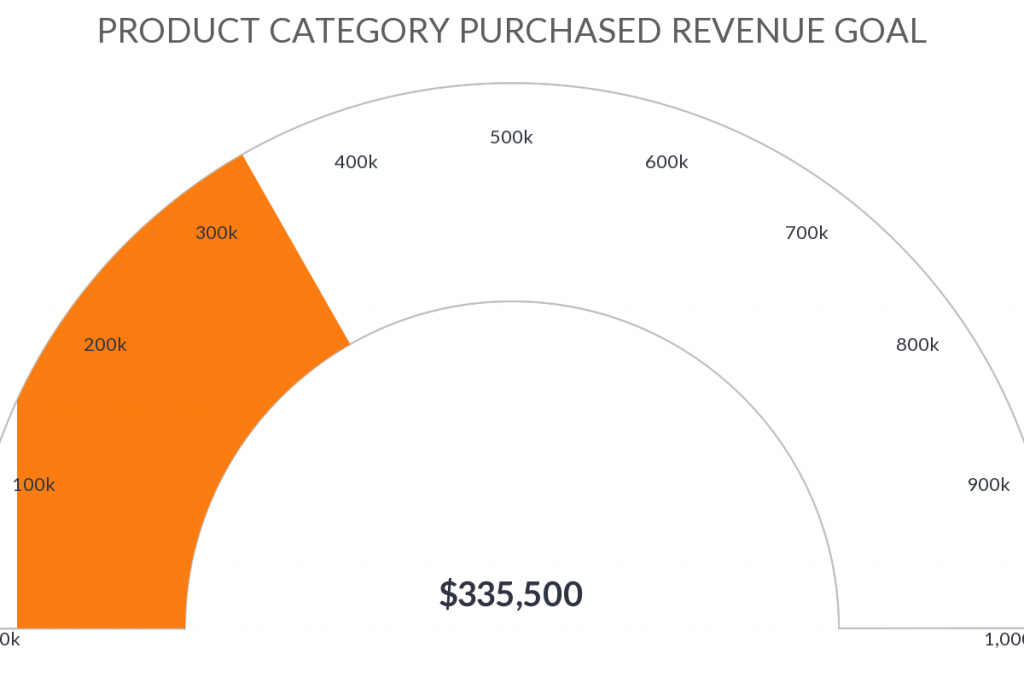
Product Category Revenue Goal
Set a product category purchased revenue goal base on the timeframe that they purchased and track progress towards it.
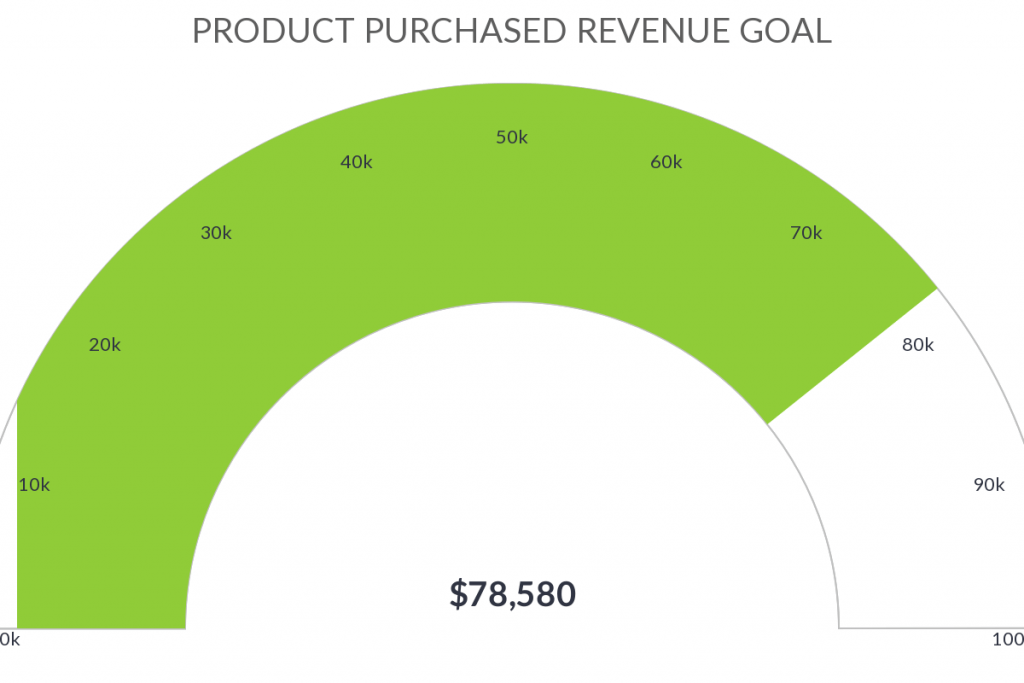
Product Purchased Revenue Goal
Set a product purchased revenue goal based on the timeframe that they purchased.
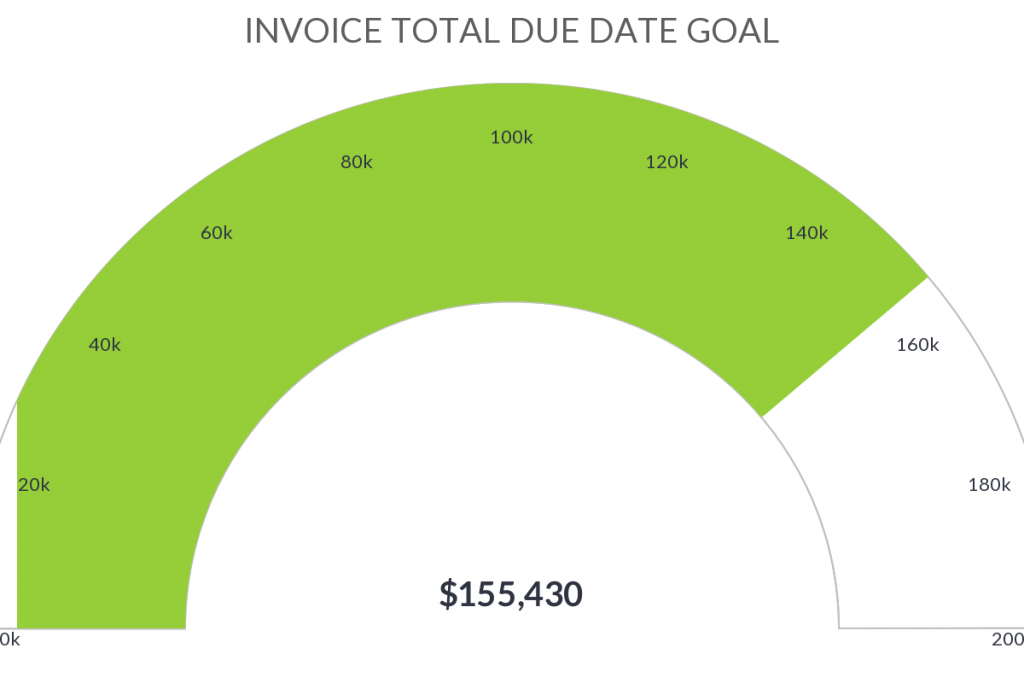
Invoice Total Due Date Goal
Set an invoice total goal based on the Due Date and see your progress towards it.
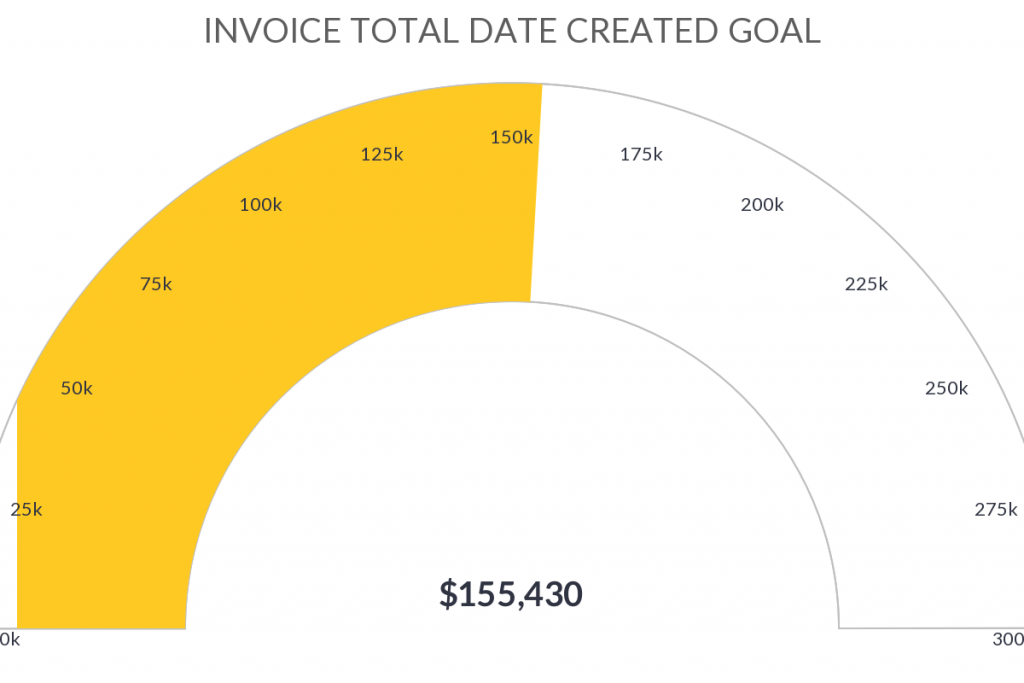
Invoice Total Date Created Goal
Set an invoice total goal and see your progress towards it.
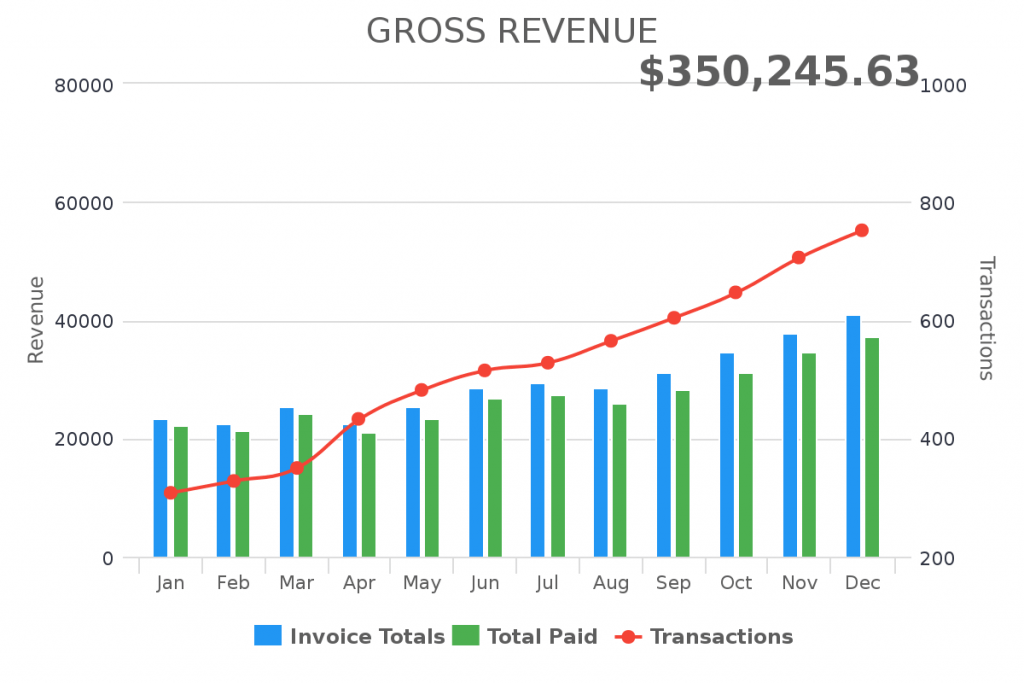
Gross Revenue
Displays invoice totals, total collected and the number of transactions that represent the revenue.
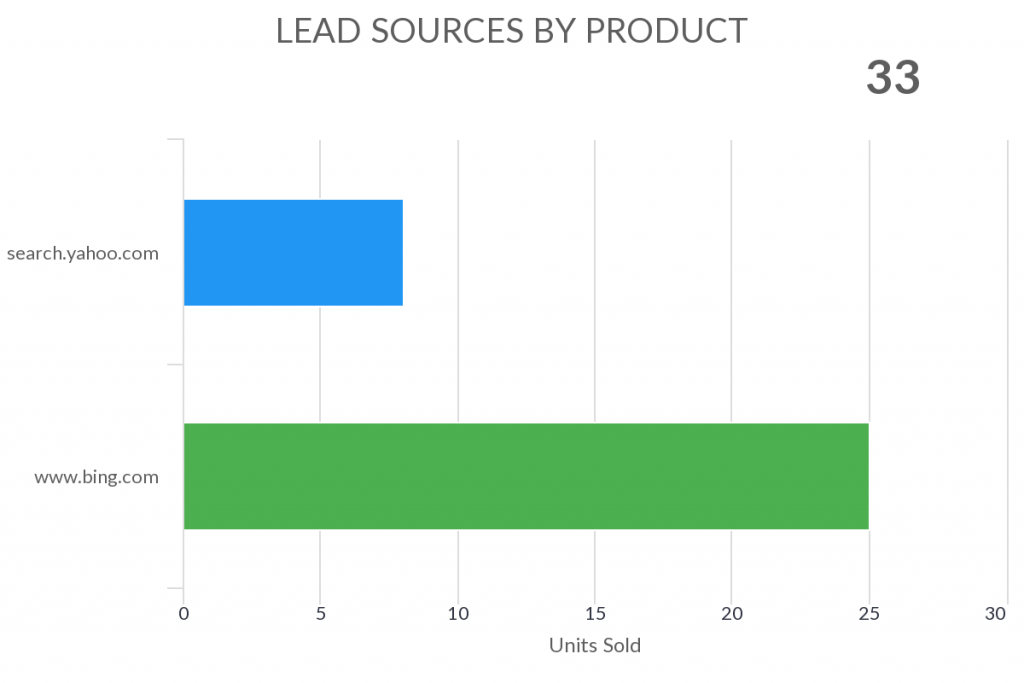
Lead Sources By Product
Show the lead sources that generated the selected product sales.
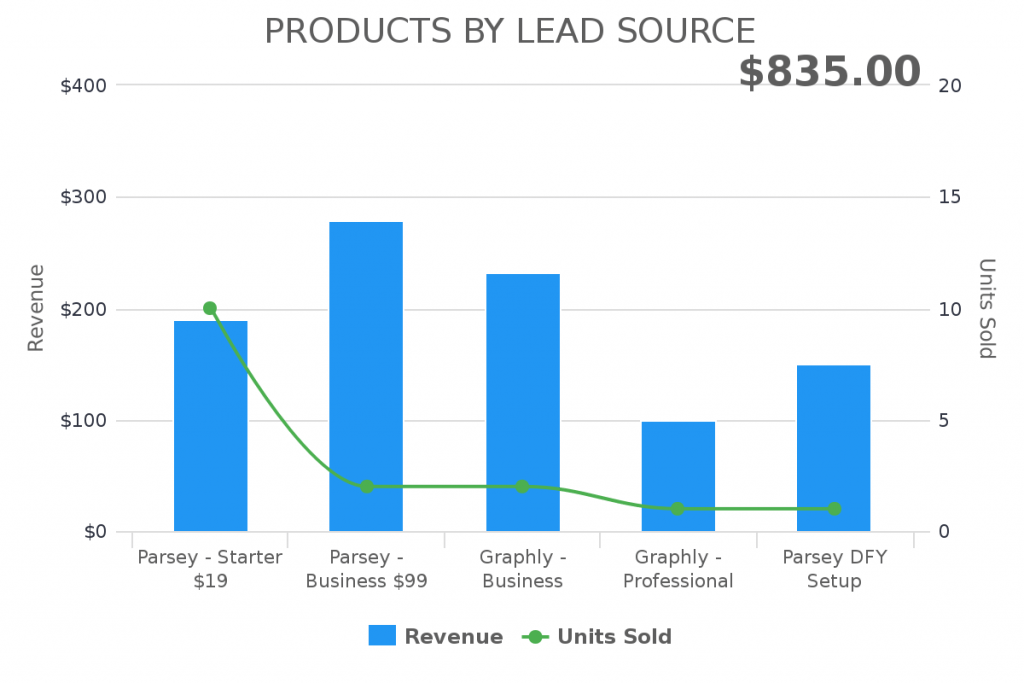
Products By Lead Source
Show the net product sales (subtracts discounts), from a selected lead source.
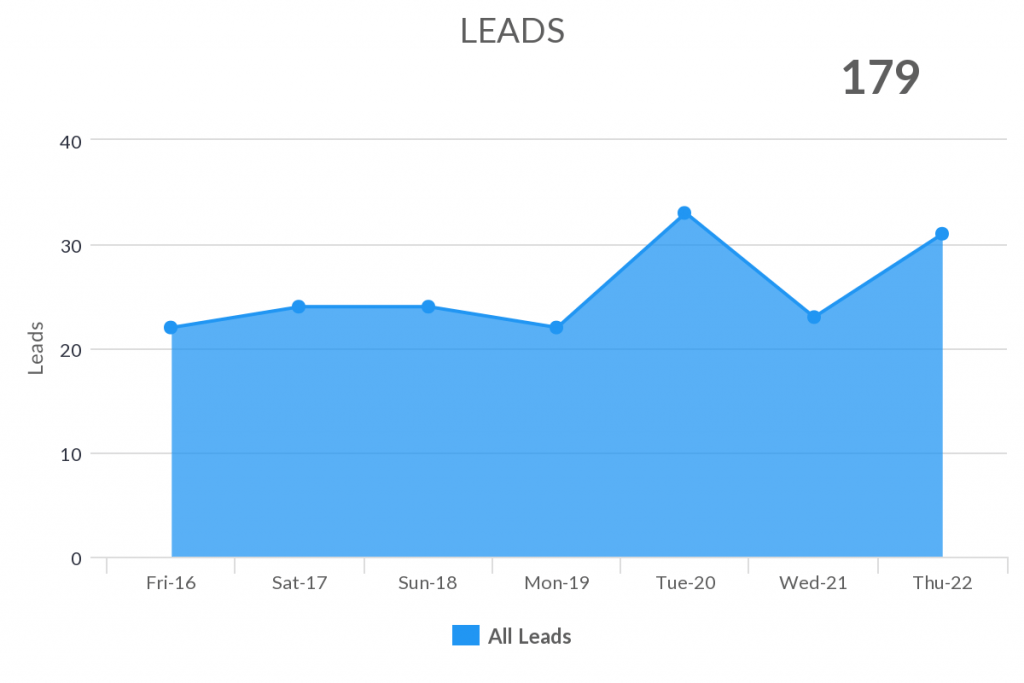
Leads
Show the total number of leads coming in within a date range.
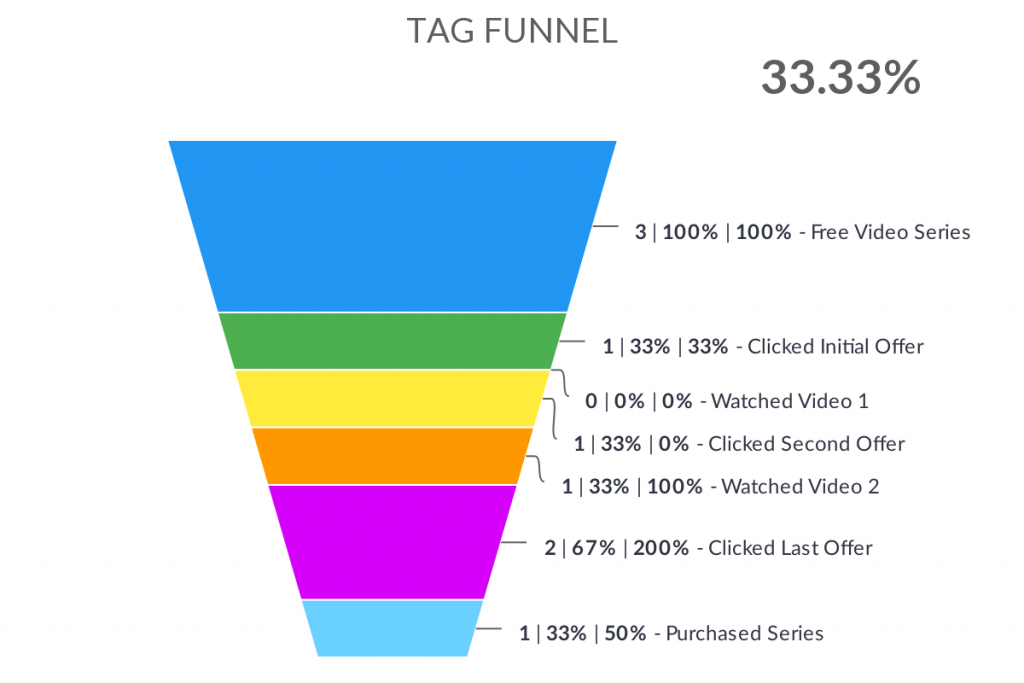
Tag Funnel
Displays the number of contacts in a list of tags over a given date range.
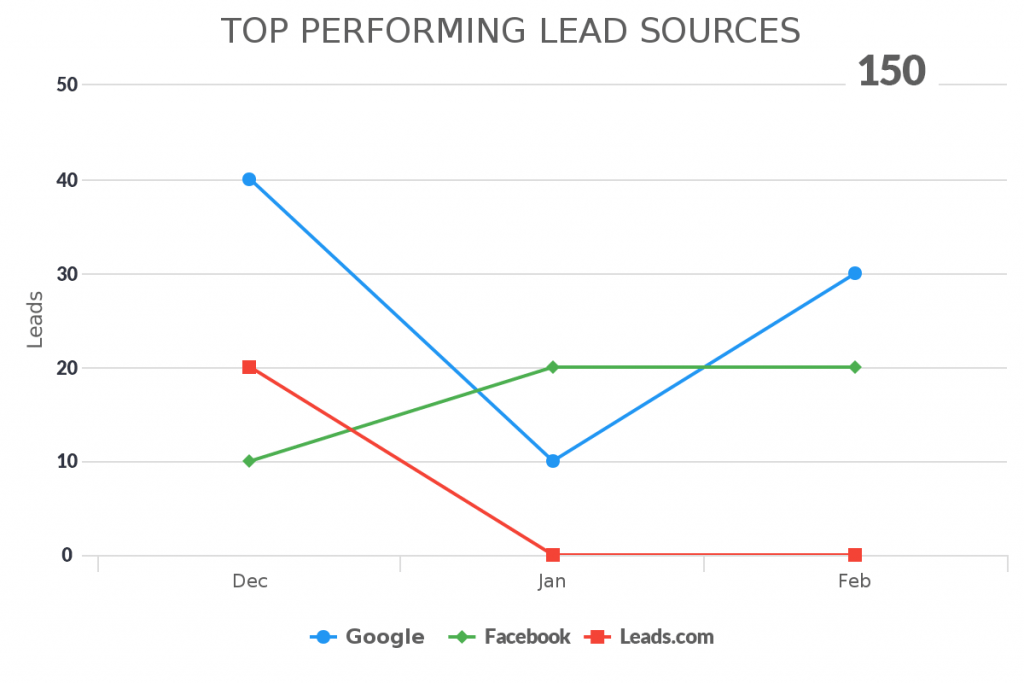
Top Performing Lead Sources
Stop throwing money after bad lead sources and start investing in the ones that are thriving.