Graphly has been known for it’s order reports that give deep insights into invoices, payments, outstanding balances, subscriptions, cancellations, refunds and a whole lot more. But we were missing one thing – helping our users distinguish new customers from repeat customers. And possibly more importantly, what’s a new customer worth?
Want more customers?
Of course you do. We all do. Instead of diving into the mechanics of advertising or optimizing funnels, I’d like to introduce a basic truth: where performance is measured, performance improves. Measurement, is the foundation for growth and attracting new customers before any marketing technique or sales tactic takes effect.
After all, you have to fully understand the problem before you can solve it.
In addition to our value per lead report, our value per customer report, and a handful of lifetime value reports, we’re releasing two new reports that bring ultimate clarity to your customer acquisition efforts.

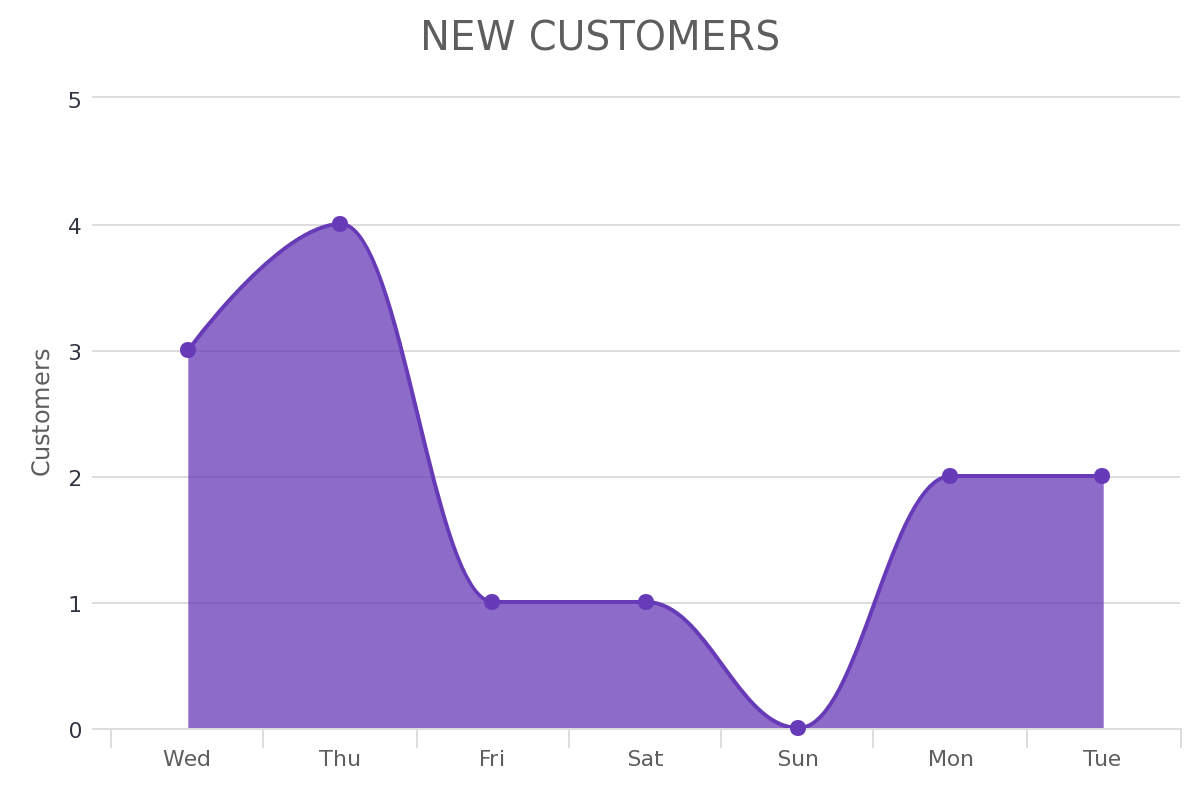
New Customers
The New Customers report sifts through your orders and returns the orders that are the first order record for each unique contact record. You’re given options to define a new customer by either the first invoice date or the first payment date. For those of you who capture a credit card, create an invoice but delay the first payment 30 days, you’ll appreciate the flexibility of deciding when your organization counts the prospect as a new customer. Is it the moment a credit card is entered? Or is it the moment you successfully charge that credit card?

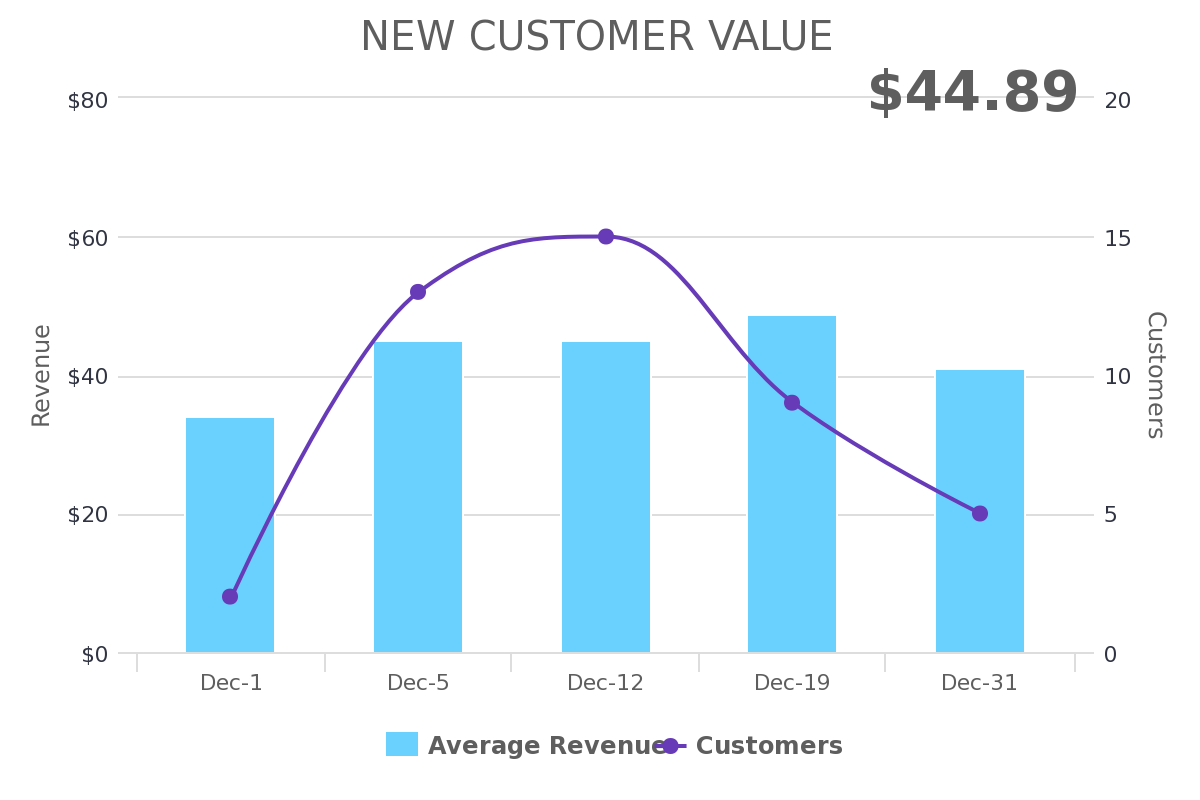
New Customer Value
This next report was suggested by one of our valued customers (more on that later). The New Customer Value report shows you the initial revenue from new customers. You’re given options to calculate the revenue from new customers using first invoice, first payment or all invoices/payments on the same day of the first payment. We have a few other options as well, but let’s not get bogged down in the mud 😉 .
If you’ve used our Transactional Lifetime Value report or our Interval Lifetime Value report, you know how awesome it is to see your break even point on the cost of acquiring a new customer. Perhaps it’s 3 months into the relationship or after 5 transactions that the customer becomes profitable. But for some businesses, they can’t afford to bring on new customers at a loss. Perhaps the company offers a single product with no backend offers in place. Perhaps it’s a cashflow issue. The bottom line is, they either need or want to be profitable with every new customer right out of the gates.
The real value here is that you can easily see your average front end customer value. Compare that figure to your CAC (Customer Acquisition Cost) and you’ll immediately know if things are in the red or in the black.
Again, whether you define the front end as the very first order, or a series of orders that are created on the same day because your E-commerce system (i.e. ClickFunnels) creates individual orders for each upsell that is purchased in the funnel, we’ll do the math to show you the average amount of what new customers are worth.
I’d challenge you to add these two reports to your dashboard today. Once you have a baseline for your new customer value, work towards increasing that average over the coming months.
Happy Charting!
Jarrod Morris
P.S. We’d like to thank our customers Todd Brown and Teddy Garcia of Marketing Funnel Automation for suggesting we create the report “Average Front End Customer Value”. We took your initial input and iterated on it until we settled on what we now call “New Customer Value”.
P.P.S. Are you using Keap Opportunities? If so, you’re going to absolutely love what we release in February. We’re taking a deep dive into opportunity data to help you better gauge your sales team’s efforts, effectiveness and performance. Say goodbye to underperforming reps, neglected leads and mysterious pipeline breakdown. A few reports will be ready in a couple of weeks with a handful more by the end of February.
P.P.P.S. Have a great report or feature idea? Be like Todd & Teddy and let us know about it here: https://graphly.uservoice.com
