This last week we attended Keap’s annual conference for their partners, PartnerCon (or PCON if you’re really hip). It was by far the best PCON yet (see how hip I am?). While there, Keap put on a Delightacon. Basically they had a team of 30 or so just crank through 14 new features / product enhancements for 3 days.
This announcement was made on day one. And while I plan to do an entire event recap in a different post, I’ll say this…we felt really inspired by their efforts. We hadn’t planned on adding any updates to Graphly since the entire week would be consumed by event stuff.
We decided to change that and deliver a few goodies to our users as well, despite being pretty strapped for time.
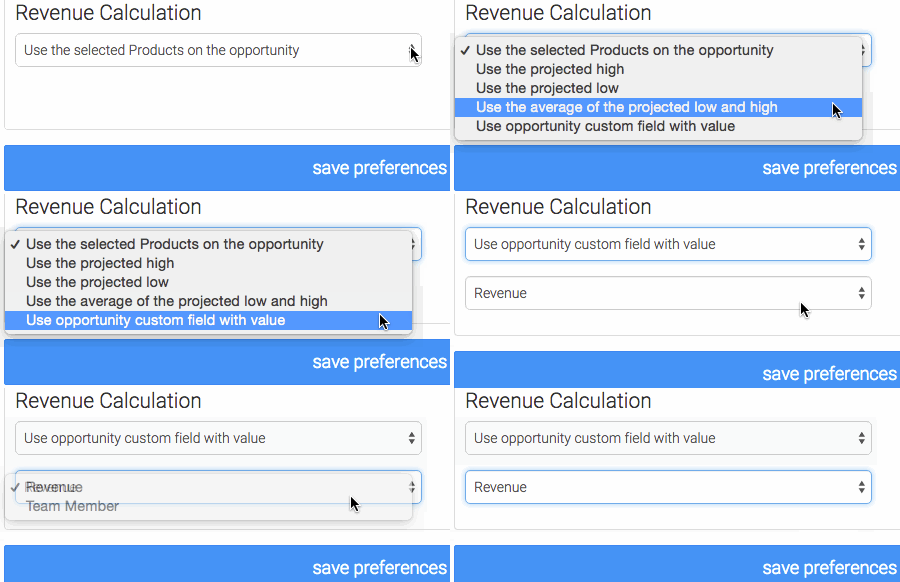
 The first enhancement is pretty exciting, and it relates to opportunities and how revenue is calculated.
Now you can sum up revenue based on values stored in custom fields. Big thanks to one of our valued customers (Ben Norman) for funding a portion of the development of that feature. There will undoubtedly be other users who benefit from this feature. Ben bumped up the development of it by a good 3-4 months. Feel free to buy our mate a cold one next time you see him 😉
It wasn’t until writing this post that it occurred to me that this type of thing would be huge for real estate, insurance and mortgage brokerages; companies who don’t have products, and don’t like the high/low projections in Keap. It also allows you to create unique reports when there are a series of financial numbers to report on. For example, a single opportunity could contain a down payment value, a monthly recurring value, premium, interest payment, deductible, tax, shipping, you name it, and you could have a widget for each value on your Graphly dashboard. Super cool, right?
2 New Opportunity Reports
Well sort of…we decided to join what could considered 2 reports into 1, allowing you to display the data how you want to see it.
 Opportunity Pipeline Summary
This report shows you a current snapshot of your opportunity pipeline. You can configure it to return the revenue broken down by stage and summed up in the top right corner or have it return the count of opportunities in each stage, with a total count in the top right corner.
Turkey Time
Now, for those of you who made it to the end of this post and are salivating just thinking about tomorrow’s big meal, check out this off-the-cuff video I shot with my brother-in-law a couple years ago. It has well over 20,000 views which means I’m practically famous 😉
In all seriousness though, thank you for being a Graphly user. And even if you’re not a user, thank you for at least stalking us on our blog here. We really do appreciate it.
Happy Thanksgiving!

