Today’s product update is a response to numerous report requests from our customers. While we have a queue of reports we’re building determined by more than a decade of consulting businesses, we truly appreciate the feedback from our existing customer base that spans so many niches, industries and unique business models.
Revenue Reports
When we first launched Graphly (just 2 years ago) we had 6 revenue reports that were goal driven. This meant that you could input a quantity or dollar amount as your target and then Graphly would show you how you’re doing in relation to your goal (Chart Type: Gauge). These are those reports:
- Invoice Totals – Date Created
- Invoice Totals – Order Date
- Product Purchase Totals – Order Date
- Product Category Purchase Totals – Order Date
- New Subscription Billing Amount Totals – Start Date
- All Active Subscription Totals
Along the way we’ve added numerous payments and net revenue reports to help businesses understand what they’re really taking home. But until now, we never circled back on these original goal reports. After all, anyone who has been in business knows that there’s usually a difference between what gets invoiced and what gets collected. With that in mind, I’ll introduce you to the first report – Invoice Paid Goal.
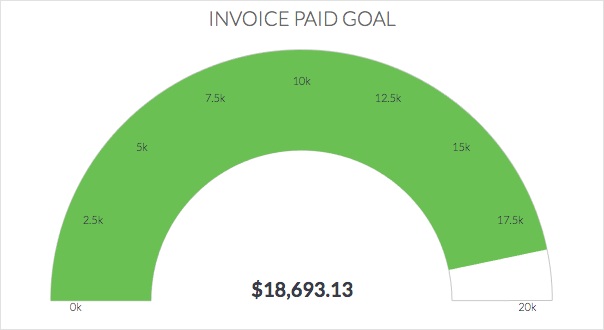
Invoice Paid Goal
Do you have a goal of collecting a certain amount on invoices with in a certain date range? Now you can easily measure your progress towards that goal. Different from just seeing Invoice Totals, this report will show you invoice totals of what you’ve actually collected.
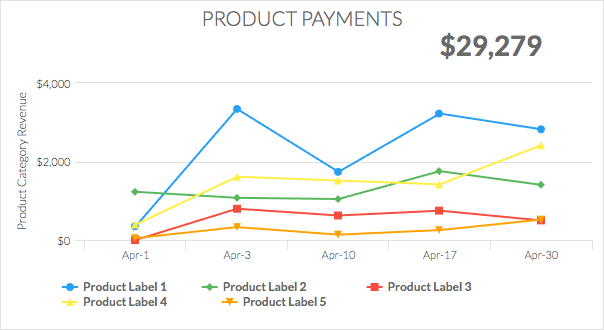
Product Payments
Have you ever wanted to compare the sales of one product to the sales of another product and see how they stack up? Hopefully you’re aware that this has been doable with in Graphly for quite some time with our Product Revenue Report. However, as mentioned previously in the post, that report uses invoice totals as opposed to actual payments. The Product Payments Report actually breaks down payments you’ve received by the products that are line items on those paid invoices. Perhaps some products have a better collections rate than others. Hence, the Product Payments Report shows you the true leaders among your products.
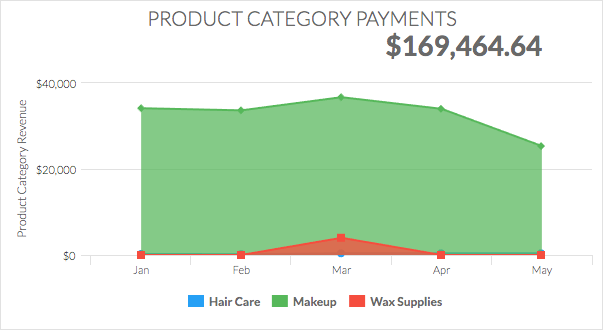
Product Category Payments
Similar to the Product Payments Report, the Product Category Payments Report helps you compare the performance of your various product categories to each other (based on what is actually collected, not just invoiced).
Purpose of these Revenue Reports
We hope these reports will help you identify winning products and even leading product categories. We also hope you’ll be able to quickly identify struggling products and categories. Use the insights from these revenue reports to reallocate your focus or budget and make course corrections as needed to create even bigger wins in your business.
Have an idea for a report?
While users tend to email us, live chat us, call us and even private message us on social media accounts about report ideas, the best place to capture and organize those ideas is in our UserVoice Forum. When a particular idea rises to the top because of the increasing number of votes, we do our best to pull the idea into our development pipeline.
If you have a reporting need that is either urgent or unique in nature (may not gain a lot of votes), we occasionally take on custom dev projects to meet those needs. Feel free to contact us directly if you’d like to discuss a project.