
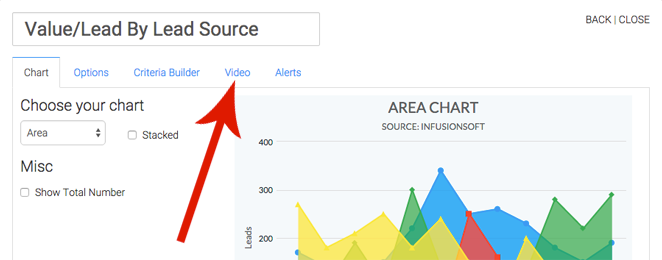
While we love our knowledge base and help desk software (shoutout to HelpScout), we realize that when you’re in the middle of configuring a report, it can be pesky to leave the software for further instruction. That’s why we recently added a video tab (soon to be seen on all templates) with a video specific to the report template you’re configuring.
Want to try it out? Log in to your Graphly account now and click “Add Widget” using one of our most recent report templates.
With out further adieu, here are the newest report templates:
 Payments
For those who have experienced frustration after seeing one amount in an invoice-based report and an entirely different amount in your bank account, this little ditty is going to narrow that gap for you by allowing you to see revenue actually collected over a given time frame.
Payments GoalSimilar to the Payments report above, but based on working toward a goal (revenue amount) that you specify. Measure progress for payments you wish to collect over a given time frame. The progress gauge will reveal performance to goal at a glance.
RefundsEver feel like you’re giving the farm away? Now you can keep a finger directly on the pulse of your refunds. Set your time frame along with any other additional criteria you wish to consider. And no, we don’t have a Refunds goal template for obvious reasons 😉
Subscription CancellationsThis report template will show you the number of subscriptions that are canceled or inactivated during a given time frame. Retention is critical to a recurring revenue business…use this report template to keep track of your outflow in addition to your inflow.
Subscription AttritionSimilar to the subscription cancellations above, the subscription attrition template displays the attrition rate over a period of time. Attrition is calculated by the number of canceled subscriptions divided by the active subscriptions within the same time frame.
Subscription Lifetime ValueLifetime value is one of the most important numbers for a subscription based business to track. It helps you determine how much you can spend to acquire a customer. As you increase your LTV, you can increase your budget to acquire new customers. Outspend competitors and win market share.
Average Subscription PriceThis template helps you find the average billing amount of a subscription or group of subscriptions. i.e. Graphly has 5 different plans. This report shows us the average amount each Graphly user pays monthly for our service. Once we have our baseline, we try to ascend customers and grow that number.
Value Per Lead by Lead SourceThis report template calculates the value that each lead and/or customer is worth based on the lead source(s). You determine the time frame of how many days after a lead is created to count revenue. This is huge in knowing how much you can spend to acquire a customer and when you’ll see a positive ROI.
Value Per Lead by TagVery similar to the report above but based on tag(s) instead of lead source(s). So you can use this for calculating value of newly created leads, or measure the value increase on an existing contact record by counting the revenue for “X” days after a tag has been applied.
You’re still here? Really? We love you for that! Seriously. If only all businesses were this committed to making data-driven decisions. Keep it up and rapid growth is inevitable my friend.
Until next time…Happy Charting!
Team Graphly