Building Recurring Revenue
First, the case for building recurring revenue. Ryan Chapman, a good friend and Co-Founder of FixYourFunnel once told me this in a mastermind meeting, “Every morning I wake up a winner. I would never start a business that didn’t have some form of recurring revenue.” Despite Justin Bieber’s warning, ‘never say never’, Ryan is adamant that any business he starts, purchases, acquires or partners with must have a stream of recurring revenue (ideally 80+% of its revenue would be recurring). No offense to The Biebs but I think Ryan is right on this one. Never do business with out some recurring revenue in place.
The sad truth is that over 80% of businesses go out of business with in the first 5 years, and only 6% of those that survive actually hit $1,000,000 in revenue, ever (source: “Scaling Up”, Vern Harnish). Want to be part of that elusive 6%? The secret is recurring revenue. Do you want to start each month, each week, each day at zero? Or do you want to “wake up winning” having X number of customers already billed, your bank account full and adding to it with new sales? The secret is recurring revenue.
Below is a model that compares one-time revenue versus recurring revenue. For simplicity’s sake, the model makes two assumptions.
- Zero increase in sales growth rate as the year progresses
- Zero attrition
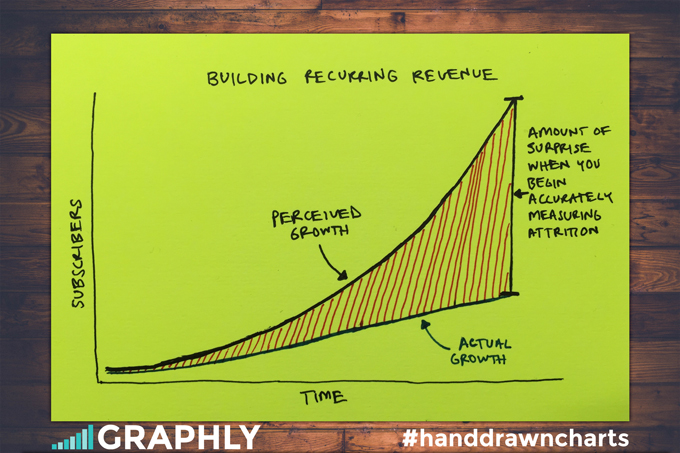
For obvious reasons pointed out in the hand drawn chart above, never negate attrition in real life scenarios. The following example is merely educational.
The Scenario
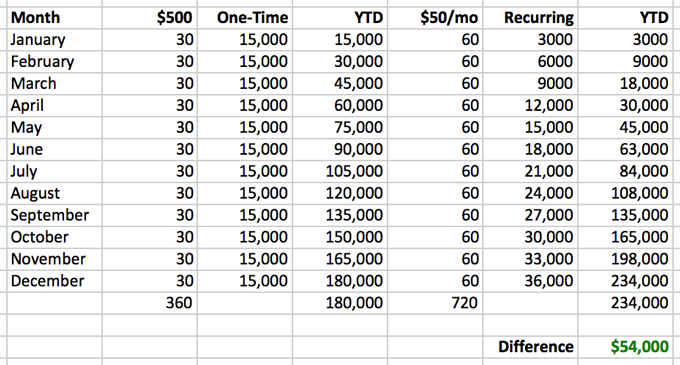
As you can see, we’re comparing a company that sales a $500 product to another company that sales a $50/mo subscription (companies A & B respectively).
Company A sales 30 new customers each month. Company B sales 60 new customers each month, which should be easy to do since the price point is 10% of what Company A is offering.
By the end of May, the two companies both bring in $15,000 in a single month. And while Company B begins bringing in more revenue per month moving forward, they have a lot of catching up to do as they fell short of Company A’s revenue in those early months. The two break even on YTD numbers by the end of September.
That’s when Company B begins to make its case for recurring revenue. Over the next few months the annual difference ends up being +$54,000 for Company B. That’s impressive. It represents 30% growth just by incorporating a different sales and pricing model than company A. But what happens in year 2? That’s when the chasm between one-time revenue and recurring revenue really widens.
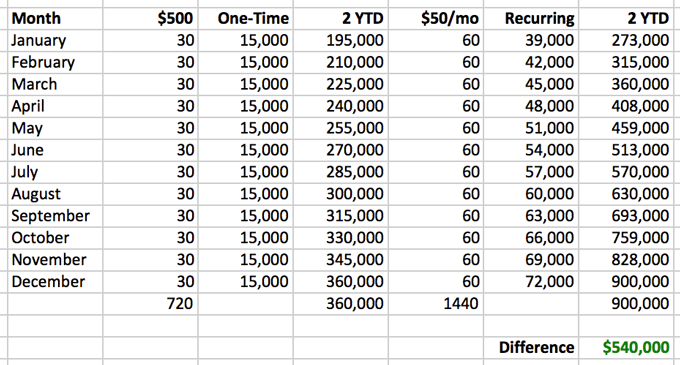
Now the difference looks like $540,000 in Company B’s favor. And with in a few short months Company B will be doing a million dollars in annual revenue, be producing 3X what Company A is doing and if we were to look at year 3 in its entirety, the case for one-time revenue simply becomes futile. Keep in mind, this is all with a constant rate of sales. If you can grow the customers you sell month over month, Company B becomes exponentially larger than Company A. Case made.
What to Measure
So you’re sold on recurring revenue? Good. It’ll keep you in business and give you a shot at that million dollars mark. And if you’ve already reached that, congrats, let’s push for 10MM. Here’s a handful of metrics you’ll want to pay attention to:
New MRR
New MRR = SUM of paying customers monthly fee (activated this month)
New Monthly Recurring Revenue (commonly referred to as MRR) is probably the most important metric for any subscription business. It’s certainly one of the most enjoyable metrics to look at and for good reason. It’s what makes this business model so great. You know what your baseline revenue was last month, and your new MRR shows how much you’ve added to that baseline.
Average Spend
AS = MRR / # of paying customers
Average Spend reveals the average amount of revenue you collect from each customer on a monthly basis. Whether you offer multiple subscription levels or have just a single subscription, but offer discounts on pricing – this is for you. One of the many methods of increasing revenue is to increase the amount a customer is willing to spend with you. Knowing where you’re currently at helps you predict future revenue, make strides at increasing this value as well as make better advertising decisions. If you know that the average customer takes X to acquire, and their average spend is Y, you’ll see a positive ROI in Z days.
* SEE YOUR AVERAGE SPEND HERE *
Cancellations
Canc = # of paying customers who inactivate their subscription
Keeping track of your outflow is just as important as keeping track of your inflow. Often times keeping an existing customer requires less effort than finding a new one. Cancellations are pretty straight forward. With Graphly there are three options for calculating the time of the cancellation: Next Bill Date (most common), Last Bill Date and End Date. This will impact the month in which the cancellation is attributed to. Other things to consider when measuring cancellations is breaking cancellations down by their lead source. You could have a lead source that seems like a winner because it produces sales, but it could be brining you the wrong kind of customers who don’t stay for long.
* SEE YOUR CANCELLATIONS HERE *
Attrition
ATT = # of Canc / Active Subs (same time period)
Attrition is an important metric because it gives you a more holistic view of cancellations as a percentage of your overall active subscriptions for the same time period. Once you have a baseline established for your attrition, you’ll want to make your best effort to hold that percentage or decrease it (the lower the percentage the better). Improving your attrition occurs when you decrease cancelations and/or increase sales from the previous period.
LTV
LTV = AS / ATT
While some people calculate the total spend of customers and average it out, we’re referring to subscription LTV which is more predictive in nature. Once you know your average spend and your current attrition, you can accurately forecast how long the average subscriber will stick with you and what they’ll end up spending. Lifetime value is another important number for a subscription based business to track. It helps you determine how much you can spend to acquire a customer. As you increase your LTV, you can increase your budget to acquire new customers, outspend competitors and win market share. Ryan Deiss of Digital Marketer (another happy Graphly customer) is infamous for saying he wants to outspend his competition. He can take this angle because he knows his LTV. And if he’s done a great job maximizing his LTV, he can afford to pay more to acquire a customer than his competitors can. #winning
* SEE YOUR LIFETIME VALUE HERE *
Expansion MRR
EMRR = new MRR — previous period MRR (existing customers only)
Expansion Recurring Revenue occurs when you get a paying customer to upgrade to a higher subscription. Simply put, you’ve expanded your revenue from existing customers. Expansion MRR can come from upselling (customers upgrading theirs plans) or cross-selling (customers buying additional products or services).
Run Rate
Run Rate = 1 MRR x 12
Run Rate extends less than one year’s worth of numbers to an entire year. While the example above uses a single month which could be your current month/previous month and multiplies by 12, you could just as easily take your previous quarter and multiply by 4. Run rates can be useful for new businesses or business units within a company that have only had a short period of time to generate revenue.
A word of caution: Seasonal revenues will create a deceptive run rate if revenue is measured during the high season.
As you might have guessed by now, Graphly already delivers most of the metrics above with just a few clicks. The last two are on our radar and I’m sure you’ll see an announcement about the release of those reports on our blog in the not too distant future.
What about annual plans?
I know someone’s guaranteed to ask this, so I’ll address it head on. If you don’t bill on a monthly basis, you should normalize your revenue in a monthly amount in order to measure MRR. So if you have a $1,200 yearly plan, you’d just divide by 12 which would give you $100 MRR. In case you bill quarterly, you’d divide by 4. You can also do the inverse to measure the Annual Run Rate, or simply ARR, by multiplying you MRR by 12.
Best of luck building recurring revenue in your business and as always, happy charting!
Team Graphly
P.S. What questions do you have about building recurring revenue? Add your thoughts in the comment section below.