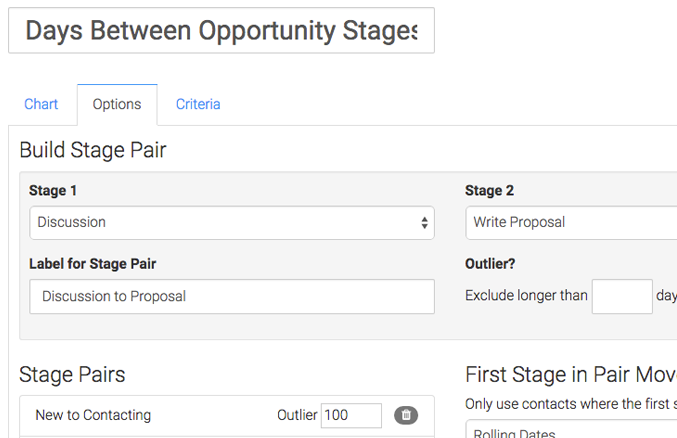
Want to know how long it takes your team or an individual sales rep to move opportunities from one stage to the next? With this new template you can build your stage pairs, define your outliers and set your date range. With in minutes you can produce a handful of reports with varying criteria.
 Tag Funnel Conversion
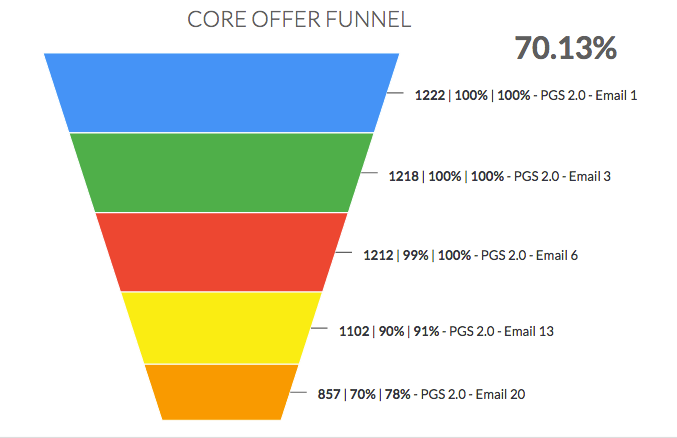
We completely revamped the ‘Tag Funnel’ reporting template with 4 user-defined options: Show Number of Contacts, Total Funnel Conversion, Conversion From First Tag and Conversion From Previous Tag. These counts and percentages provide instant insight with out the end user doing any work.
 Additional Reporting Criteria
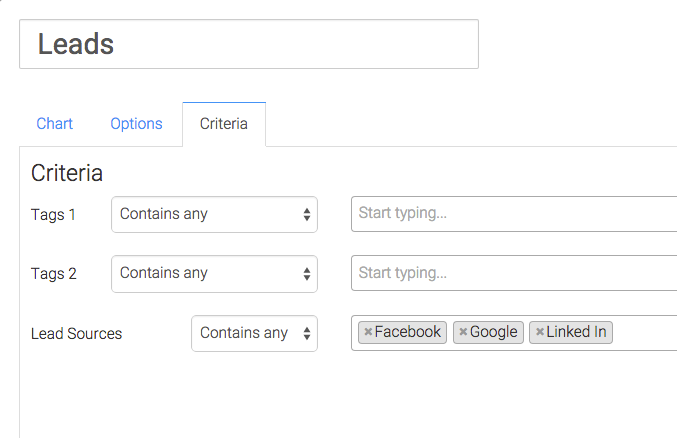
From any reporting template, check out the criteria tab. Notice that we added a bunch of criteria related to lead source, tags, owners, etc. A simple example is taking the leads report and adding lead source to it, which now empowers users to do lead source-specific reports as opposed to a total leads report.
Simply log in to your account to see these updates and enhancements or create your free trial and get started today.
If you’re an existing user, you should have received or will soon be receiving an email asking you to vote on which of the following items would be of most value to you.
– Clone Dashboard / Copy Widget to Another Dashboard (self explanatory)
– Alerts (receive an email when X rises above or falls below Y)
– Batch Actions (when viewing list of records that represent data, be able to complete an API Goal to trigger an Keap campaign)
Please take the time to click one of those links in your email. We’ll be using the results to prioritize our development and deliver exactly what our user base is asking for. Thanks!
More Users, More Servers
Our team is looking at allocating a significant portion of our time this coming week to back-end enhancements that will decrease page load times and make things feel tight and snappy inside the app. As we begin to bring on more and more users, this process is necessary to make sure we are scaling properly and delivering the best user experience possible. This means you’ll see a dip in reporting templates being released this week but we’re confident you’ll be happy with the end results.
Don’t forget, you can always add feature suggestions or desired reporting templates here: https://graphly.uservoice.com/forums/260558-general
Happy Charting,
Team Graphly
P.S. To see the new conversions (displayed as percentages) you will need to edit any Tag Funnel widgets and check the corresponding check boxes.