Finding the right key to business success can be a lengthy discussion, but one thing is true: it’s a lot easier when you have money coming in the door. In today’s article, we’re going to cover the KPIs – key performance indicators – around your company’s sales.
While some businesses can grow and operate without tracking these KPIs, the vast majority need these metrics to know what decisions to make. Tracking the right metrics using a detailed sales report can help you know what leads or sales reps are performing the best, what stage of the sales pipeline needs adjustment, how much to invest in marketing and lead generation, and whether you are going to hit your monthly goals. We’ll cover some of the metrics you should consider using and how you can build these reports inside of your Keap account.
Avoid Vanity Metrics
Before we dive into the metrics you should be tracking in your sales reports, let’s discuss vanity metrics. A vanity metric is something that looks good but really doesn’t tell the story of whether or not your company, team, or product is performing well. For example, Number of Appointments Booked certainly has an impact on revenue, but that doesn’t mean anything if people aren’t attending the appointments or deals aren’t being closed. Another vanity metric is website traffic. Yes, your site traffic needs to go up. But that doesn’t mean you are going to sell more if you are driving the wrong traffic to your site.
To help identify and avoid vanity metrics, Tableau suggests asking these three questions:
- What business decision can you make with the metric? If the answer is “no” or “I’m not sure,” it’s not likely a metric you need to track.
- What can we do to intentionally reproduce the result? A good hint a metric is a vanity metric is that you can’t manage the cause and effect.
- Is the data a real reflection of the truth? If the data is easily manipulated or improved without major effort, the data isn’t likely to be reliable.
Answering these will help you understand whether or not that metric should be tracked and used to make decisions. Keep in mind that what may be a vanity metric for one business might be more important for your business. Just because a metric might be considered a vanity metric, that doesn’t mean you need to ignore it. These metrics can help paint the picture, but just know that it isn’t the most important metric to follow.
Tracking Revenue
This set of metrics are based around tracking and forecasting revenue for your business.
Revenue
Surprise, surprise. The first sales report we want to cover is your actual revenue. This makes your world go around. Revenue will solve many problems in business, so keep an eye on it.
Building visual revenue reports with Graphly is very simple. Once you connect Graphly to your Keap or Keap account, all you need to do is create a new dashboard and select from over 160 templates.
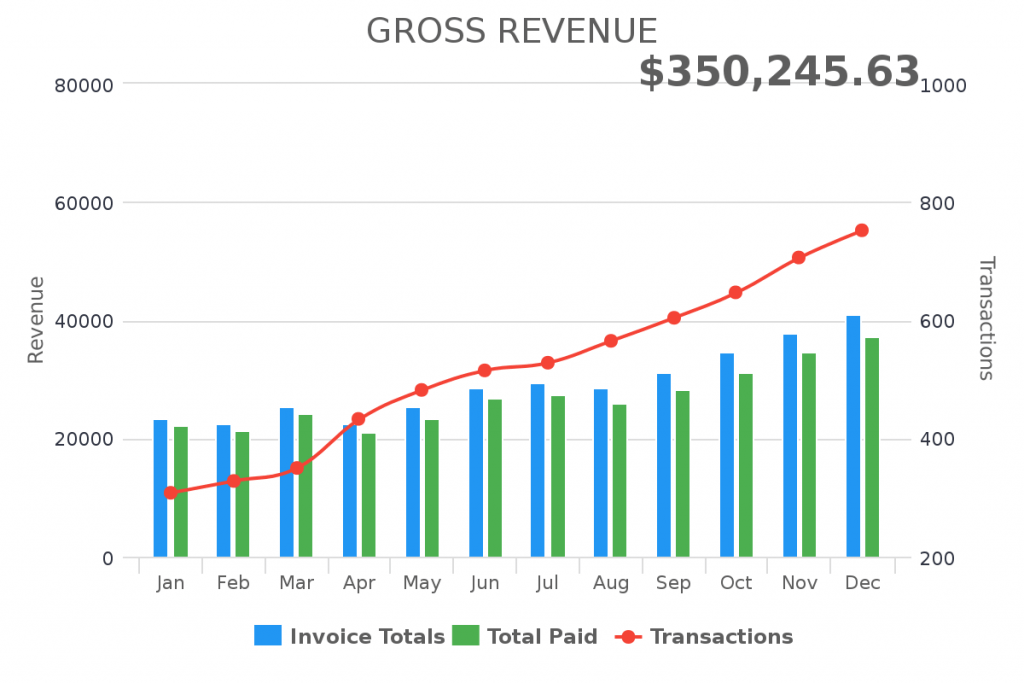
Gross Revenue Report
The most common revenue report used inside of Graphly is called Gross Revenue Report, which shows a historical accounting of the total amount you sold, how much of your invoices for that period were actually paid, and how many total transactions occurred.
The Gross Revenue report can easily be customized using the Criteria Builder. This will give you the ability to create different report types (chart, bar, line, etc.) and customize the data based on any field on the contact or order record, any tag, or any time period.
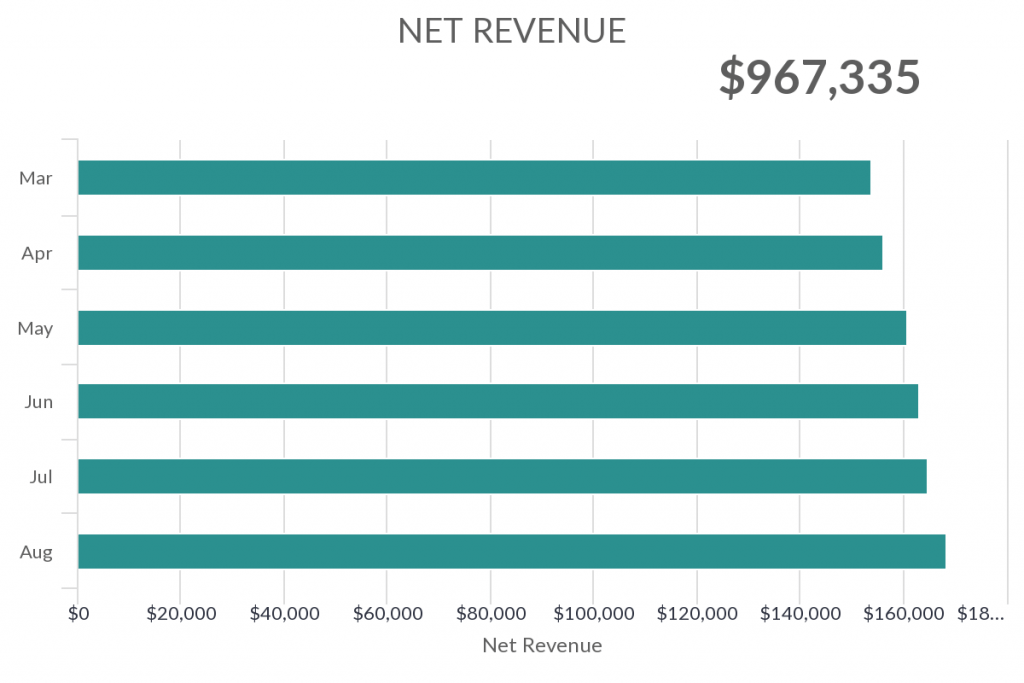
Net Revenue Report
Similar to Gross Revenue, you should also track your net revenue. Net revenue consists of what is left over after you take out the costs of shipping and sales tax. Make sure to add these costs into your Keap / Keap account so that you can have an accurate accounting of your net revenue.
Revenue Growth
How much is your revenue growing month over month? What about quarterly or yearly? These are important figures to know, especially for seasonal businesses. If you are in e-commerce, you expect to have a stronger December than October, right? But to know how strong your December is, you need to compare it to last year and then see if your growth lines up with your specific industry or the e-commerce industry as a whole. Knowing your period-over-period growth will help you see how your business is doing within the competitive landscape.
To see your revenue growth, simply duplicate your gross revenue report and adjust the time period to Last Week, Last Quarter, etc. so make it really easy to see how you are doing compared to the last time period.
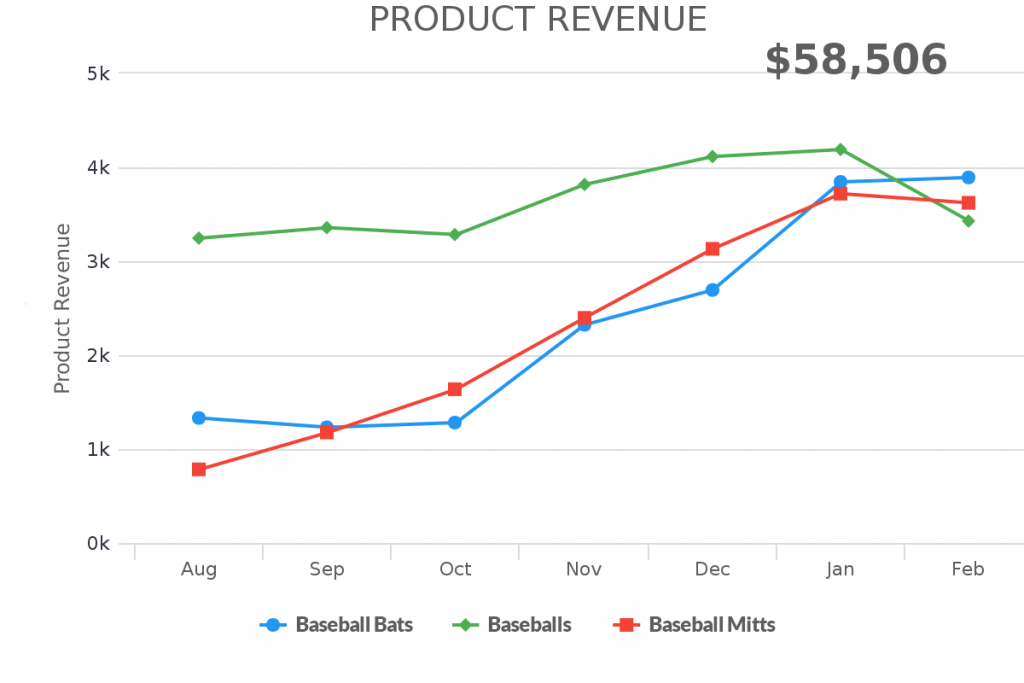
Product / Product Category Revenue
If you want to compare how much revenue was captured inside of Keap / Keap by each product, use the Product Revenue sales report. This report can help you see which products are driving the most revenue for your business over time.
Revenue Attribution
Graphly has a number of reports to help attribute revenue to the different campaigns and activities happening inside of your Keap / Keap application. We’ll save our deep dive into attribution reporting for another article. In the meantime, check out the following reports:
- Product Revenue by Emails
- Email Revenue by Products
- Campaign Email Revenue
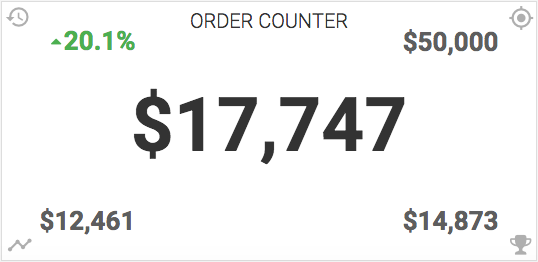
Order Statistics
This isn’t necessarily revenue, but order statistics can help you see the # of orders for a day, week, month, etc. and what day of the week or time of the day those orders are coming into your Keap / Keap application. To see order statistics, consider using one of the following report templates:
- Hourly Order Activity
- Daily Order Activity
- Daily & Hourly Order Activity
- Order Counter
Sales Targets: Hit or Miss?
Yes, we tell our children that if we aim for the moon and miss, we’ll end up in the stars. While that is a cute story with some deep, touchy feely meaning, you want your business actually hitting your sales goals. In order to do that, you need a way to properly measure your revenue against your revenue targets.
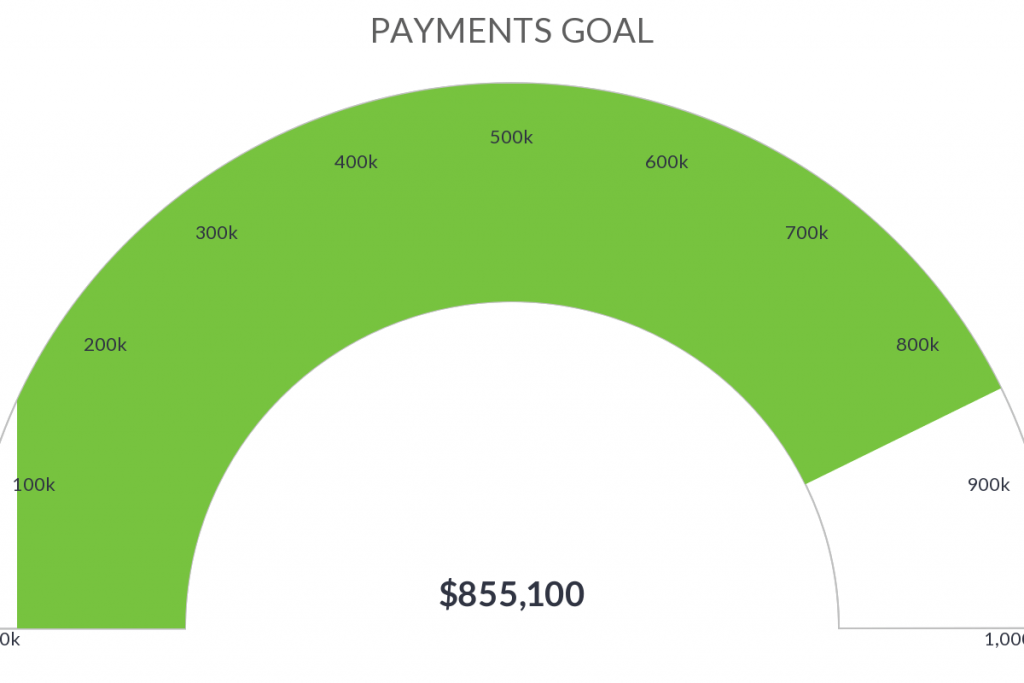
There are a number of Graphly report templates that you can customize to show whether you are on track to hit your goals. Within the Criteria Builder of your report template, you can customize the report for your specific goal and time period.
- Payments Goal
- Invoice Total Due Date Goal
- Invoice Total Date Created Goal
- All Subscriptions Revenue Goal
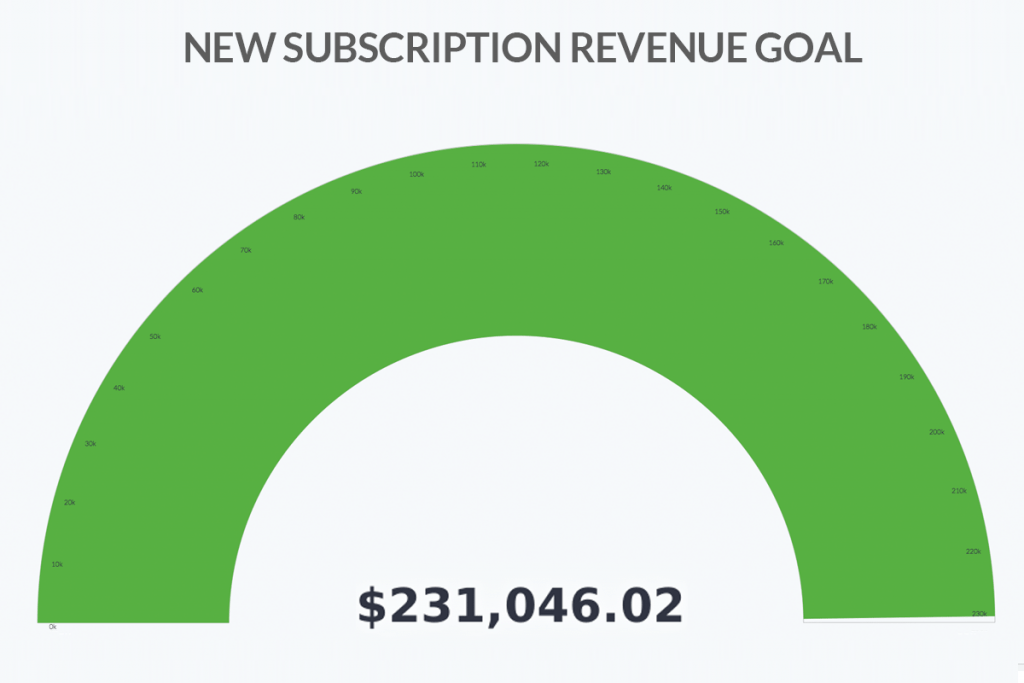
- New Subscriptions Revenue Goal
- Product Purchased Revenue Goal
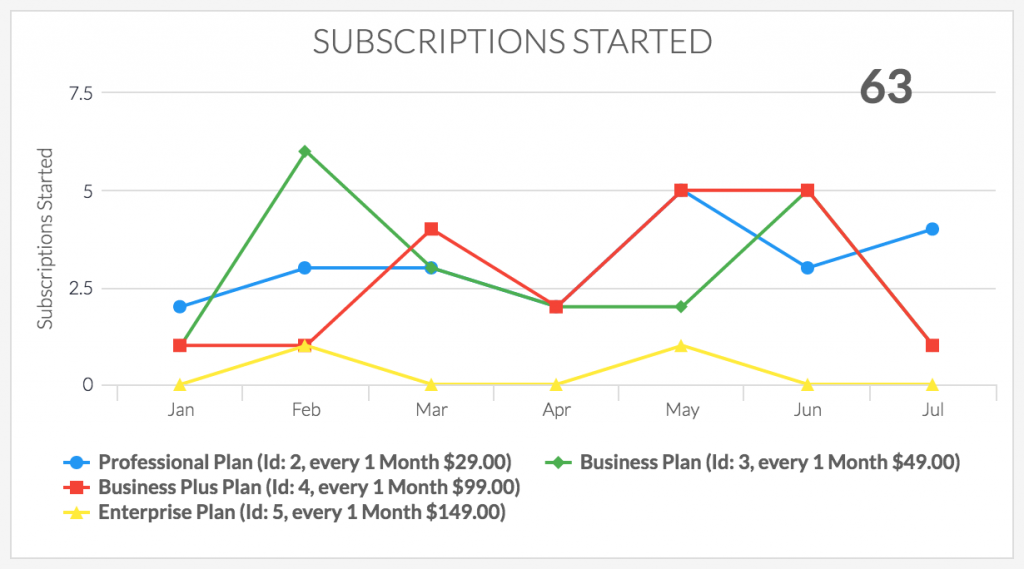
New Subscriptions (MRR)
If you have a subscription or recurring revenue business model, you have a metric called MRR, or monthly recurring revenue. This is how much money you make from current customers every month until they cancel.
With an MRR model, the majority of your revenue is recurring but it is still important to track your growth. New MRR represents new customers. To track these results, consider using the New Subscription Revenue Goal or Subscriptions Started reports.
While we are on the subject of MRR, you need to understand a few other MRR related metrics. First is churn, or the amount of customers you lose each month. The other is LTV, or the total value of your customers. We cover those in detail in the links above.
Cash Forecast
Cash forecast is another metric that is important for recurring revenue business models to track. Your cash forecast is a built-in sales report that will show how much revenue you have scheduled to bill in the upcoming period of time. This removes customers that have canceled their subscription since their last billing period. This can be helpful when trying to decide whether you are going to hit your total revenue target or not.
Right now the best way to run this report is right inside of your Keap application. Go to Ecommerce > Reports > Cash Forecast Report. Select the time period and it will show you how much is scheduled to bill for each day during that period and include the total potential revenue at the bottom. We’ll be adding a more visual version of this report to Graphly soon.
Sales Pipeline Performance
Let’s discuss your sales pipeline, also known as a sales funnel. Your sales pipeline is where your new leads are turned into new customers by your sales team, which could include a large team with specific roles or just a single person that does it all. Regardless of the size of your sales team, it is important to know how your sales pipeline is performing.
Your sales pipeline starts with lead generating activities, but those leads don’t enter your official sales pipeline until an opportunity is created.
What is considered a lead vs an opportunity? There can be some differing opinions on what determines when a lead becomes an opportunity, but generally speaking, you should create an Opportunity inside of Keap when a qualified lead has a high probability of becoming a customer. To help better understand that, check out this article from Hubspot.
Opportunities
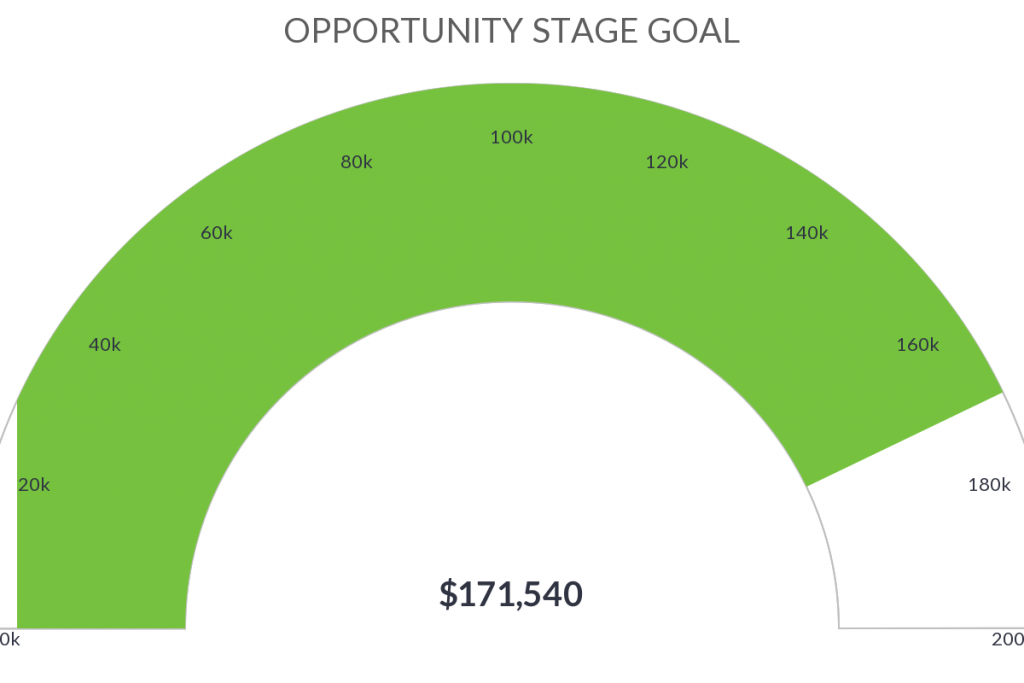
One of the first sales pipeline metrics to track is the number of Opportunities being created. This will help determine the effectiveness of your lead generation activities. Afterall, what is the point in spending all the cash on facebook ads, content marketing, webinars, and event booths if they aren’t turned into sales opportunities?
If your business isn’t creating a significant amount of opportunities this week and you have an average sales cycle of 6 weeks, it becomes easy to see that your sales might dip in 6 weeks.
The best sales report to see how many opportunities have been created is the Opportunity Stage Goal template. This report can help you measure how many opportunities are currently sitting within a specific stage of your pipeline. Within the criteria builder, you can filter this report to only show the opportunities for a specific sales rep (opportunity owner) or filter the report by any other opportunity and contact field.
Stage to Stage Conversion
A sales pipeline is often referred to as a sales funnel because there are multiple stages that a customer passes through before they turn into a customer. For some companies, this might be only 3 stages with an average sales cycle that lasts a couple of days. However, for other companies, there might be 13 stages over the course of 6 months.
Measuring the conversion percentage of contacts that pass from one stage to the next will help you pinpoint where you are losing potential customers in your sales process. To create this type of sales report, use the Opportunity Funnel template inside of Graphly.
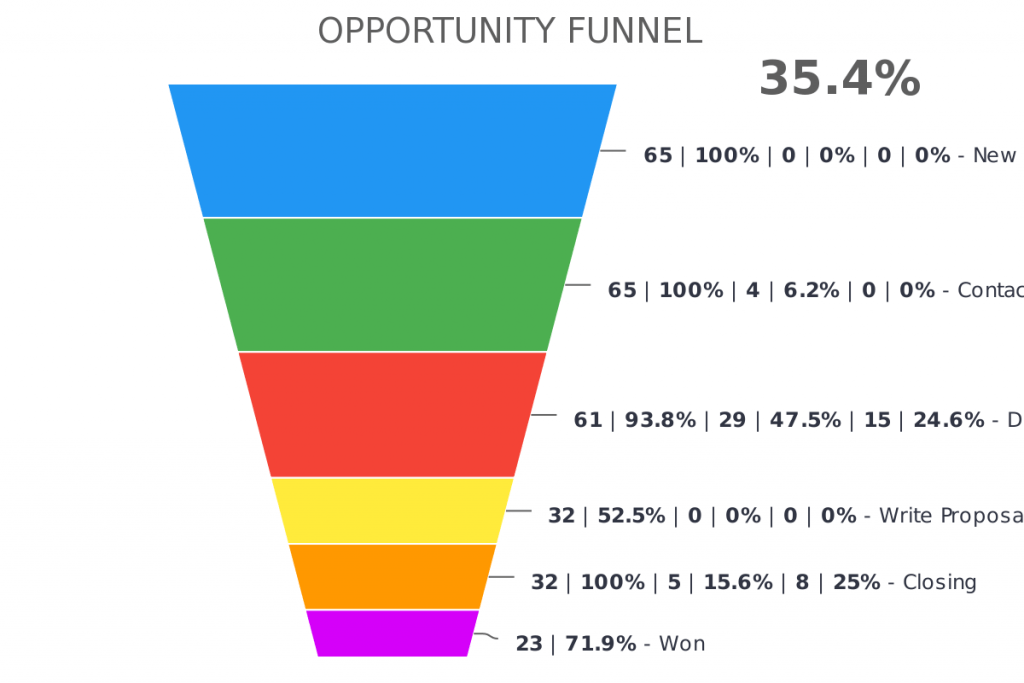
PRO-TIP: Effective sales teams will measure stage-to-stage conversion by sales rep and compare those conversion percentages to the team average. This will help show which reps perform the best and which reps need additional training on specific parts of the sales process.
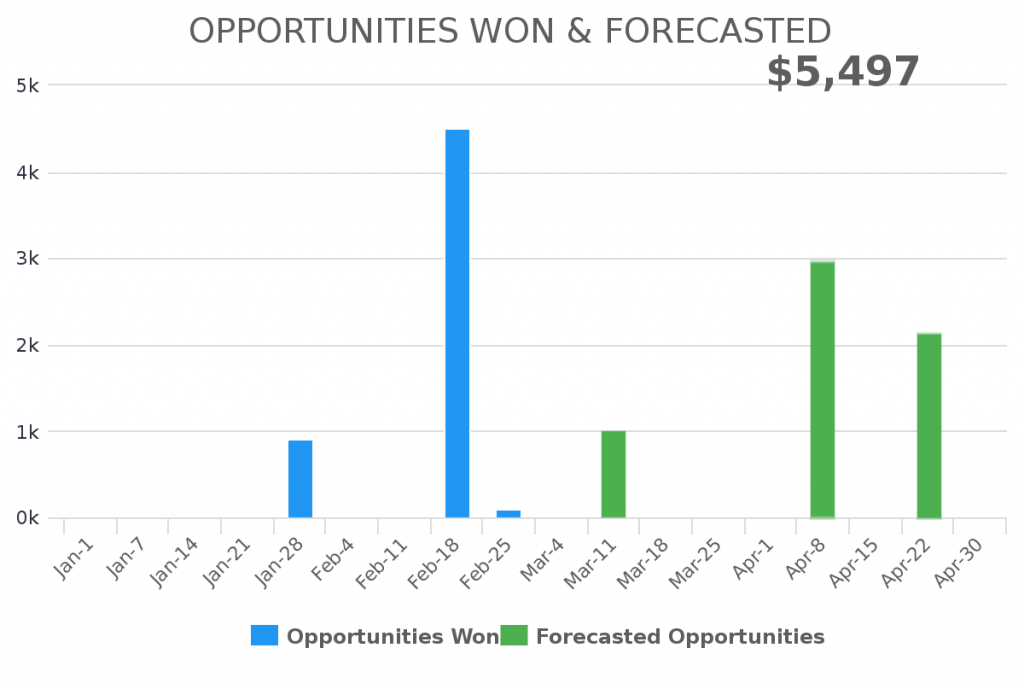
Opportunity Forecast
Like calculating your cash forecast, you may also want to forecast the sales that will come from your sales pipeline. This will show the value of the deals they believe will close. This report can help you decide whether you need to send more or less opportunities to specific reps. You can also use this metric to decide whether to spend more on lead generation or reduce your budget.
Keep in mind that an opportunity forecast report can help you gauge how your team thinks they will perform, but those figures represent what revenue will come IF your team closes the deals they think they will. This isn’t a vanity metric, but it isn’t a report to be relied on either.
Sales Rep Productivity
We’ve discussed creating revenue and sales pipeline sales reports. Now let’s discuss sales rep productivity, which is going to directly impact many of the metrics listed above. Using metrics to track your rep’s activities, habits (good and bad), and performance will help pinpoint areas of improvement and training needs.
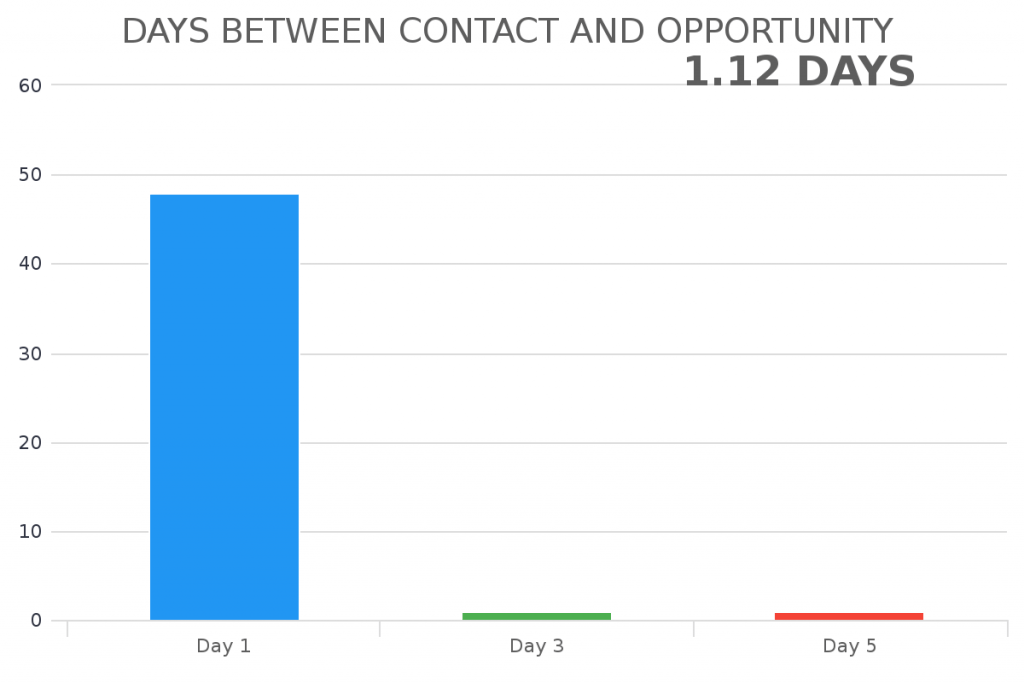
Days Between Contact & Opportunity
This is a report that will show you the average time it takes for a contact to become a lead or an opportunity. There is no correct number for this metric because it depends completely on your industry and business model. Using this metric will help you determine whether or not your leads are progressing properly. It can also help you segment your leads and know when someone is more likely to be ready to work with a sales rep. For example, if you can see leads that are moved to an opportunity after 15 days in your nurture campaign are more likely to close, it is easy to tell your reps not to waste their valuable talk-time with leads that just entered the database this week.
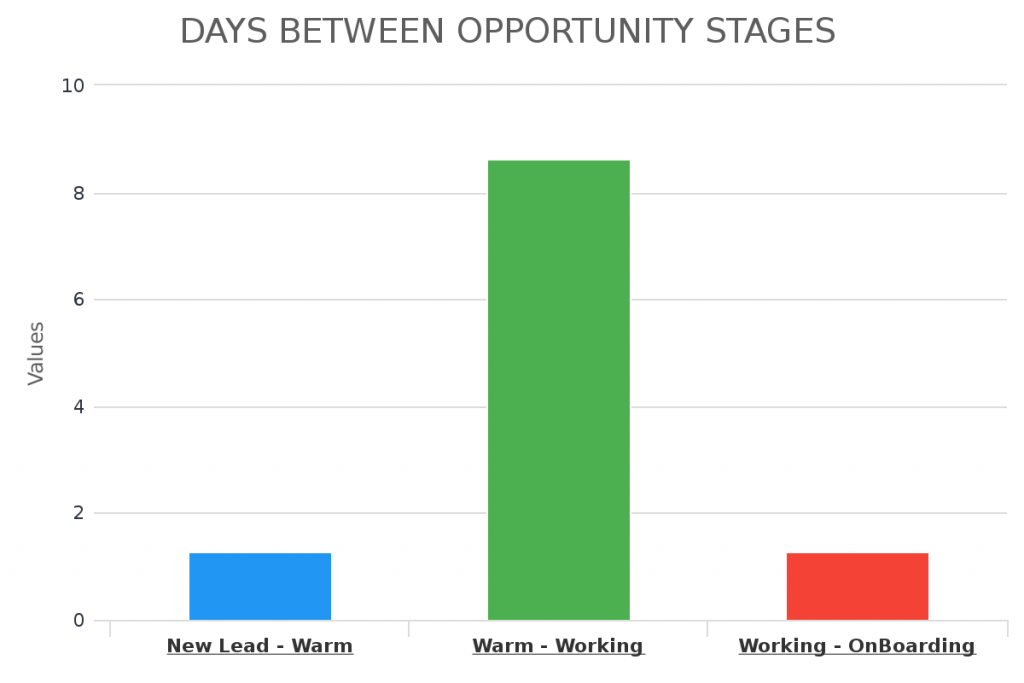
Days Between Opportunity Stages
This report will help you measure how quickly qualified leads (Opportunities) are moving through your sales pipeline. This is a great way to flag sales reps that may not be progressing leads or are not contacting their opportunities.
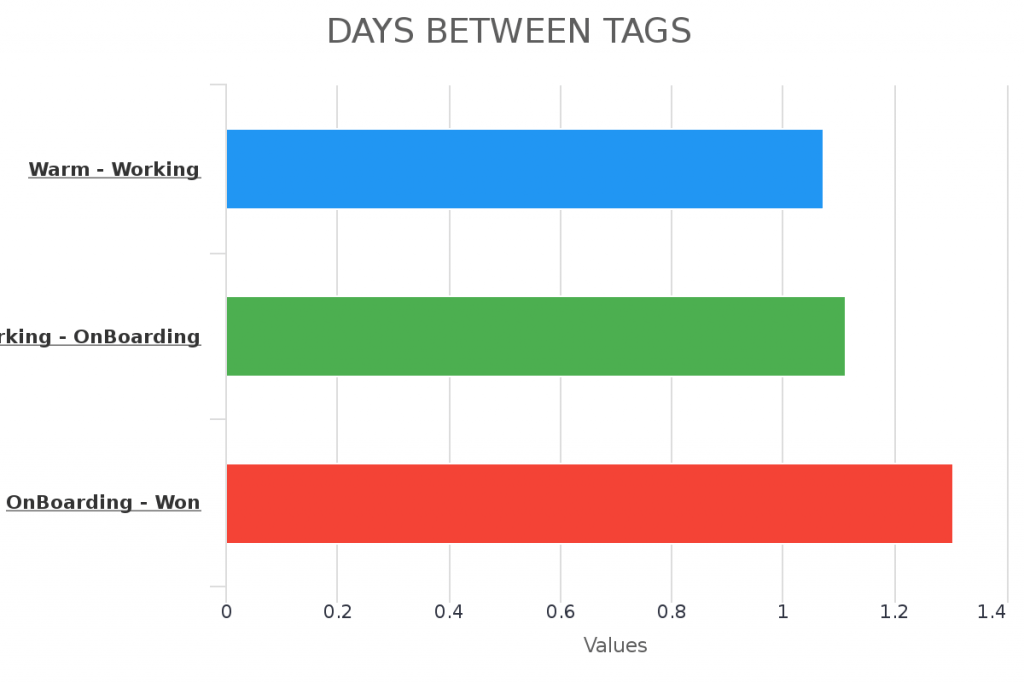
Days Between Tags
Keap is built around using tags to trigger automation and track customer’s experiences with your company. If used properly, tags can be a powerful tool when created a sales report. Using a Days Between Tags report can show you how long it took for a contact to get a call, receive an email, set an appointment, or whatever sales rep activity you want to measure. This is a great way to measure activities that are not defined by a specific sales stage.
Keep in mind that for this report to work properly, you need to have the right automation in place that ensures tags are applied and removed at the right time. If you need help with building your campaigns properly, let us know and we can get you to a Graphly Certified Partner to help.
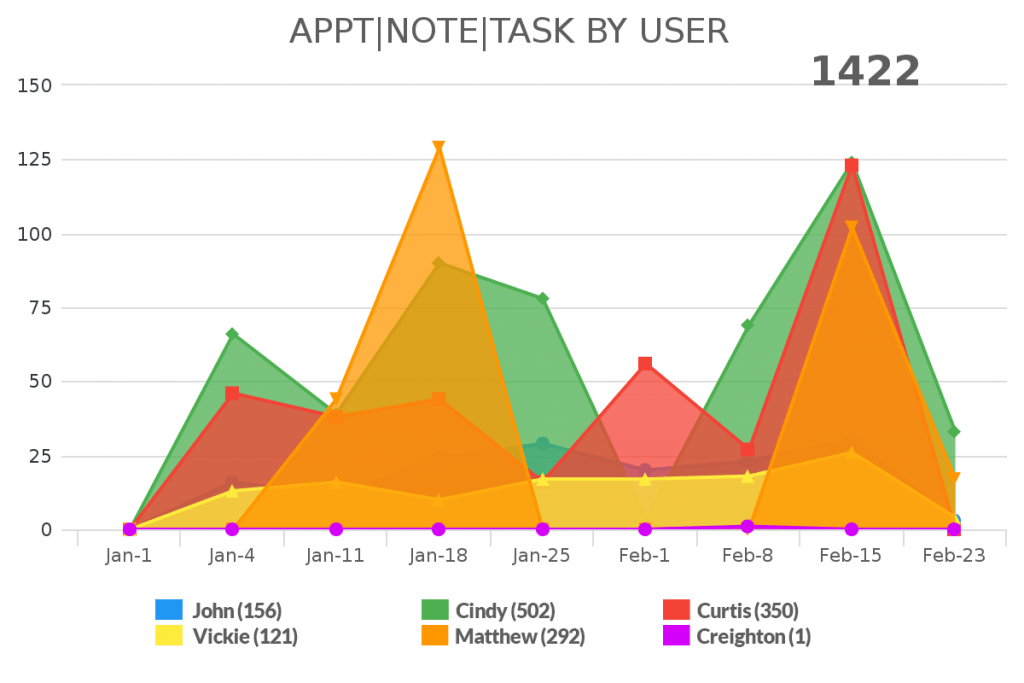
Appt/Note/Task by User
Sometimes it’s good to measure how active your sales reps are or whether they are properly using the CRM to manage their day and the contacts and opportunities they have been assigned. This report can help show that.
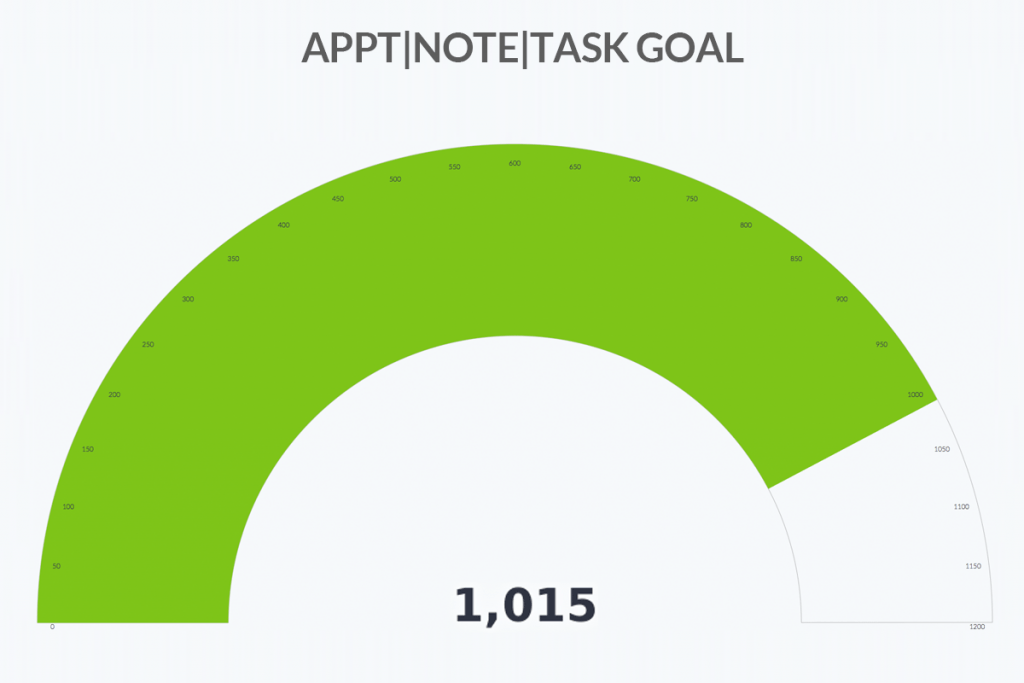
Appt/Note/Task Goal
Like the report above, this report can help you see whether your sales team is hitting their activity targets.