
The LTV of a customer helps guide your business decisions in marketing, sales, product development and customer support. For example:
- Marketing: How much can I spend to acquire a customer?
- Sales: What types of customers should I spend the most time on trying to acquire?
- Product: How can I reduce our cost of producing/delivering the product?
- Customer Support: How much time should I spend to service and retain a customer?
And those are just example questions. Chances are, once you see your own LTV, you’ll have many more. Speaking of seeing your own LTV, today we’re releasing 3 LTV reports. More on that in a moment. But first, let’s talk about the two main LTV categories.
(SKIP THE EXPLANATION – JUST SHOW ME THE NEW REPORTS)
Why Businesses Fail
Say what you will – lack of market differentiation, leadership collapse, undercapitalization, overcapitalization…all of these reasons fall under a much larger umbrella. Every company I’ve watched close their doors has the same overarching problem. It’s that their Customer Acquisition and Lifetime Value look like this:
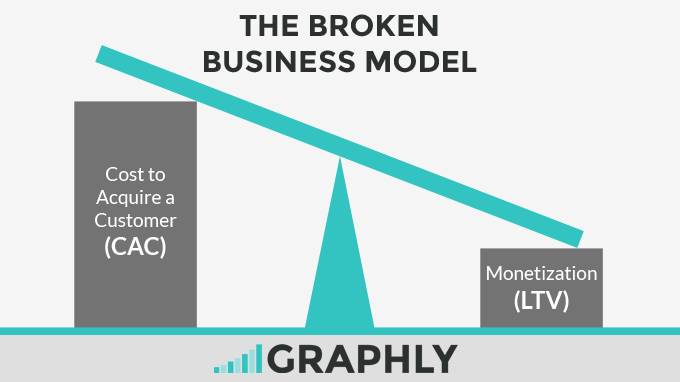
The tragic truth is that most of these companies failed to measure either one or both of these critical metrics. Had they put the right tracking in place, they would have discovered that every new customer they brought on was actually driving them closer and closer to bankruptcy. They would have realized that something needed to change in who they were targeting, how they were selling or how they were fulfilling.
Do you know your CAC? Do you know your LTV?
How often do you look at these metrics? Do they look like this?
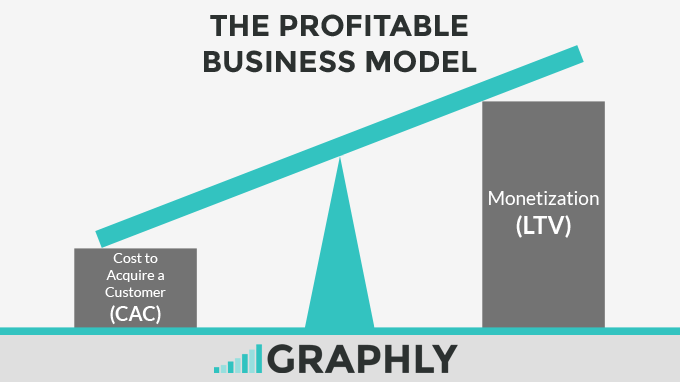
If so, awesome! If not (or if you’re not sure), let me show you how you can begin measuring LTV in your business.
Lifetime Value: Historical vs. Predictive
Simply put, historical LTV sums up revenue, divides by customers and returns an average $ amount per customer.
On the other hand, predictive LTV takes into consideration numerous variables in order to project an amount new customers will spend (on average) over their entire lifetime.
With historical LTV analysis, you’ll need to wait a couple years to know the LTV of those customers. This waiting time can be challenging for new businesses or for existing businesses measuring new products they’ve launched.
With predictive LTV analysis, you’ll know the long-term value of those new customers right away. This works especially well for those who have a subscription based model or fairly predictive repeat purchases.
* Of course, predictive LTV is only useful if the projections are accurate!
Lifetime Value

This report displays the historical trend of the LTV across a date range of your choosing. As you can see in the chart above, the LTV actually drops in both February and July. How can that be if clients are always spending? Well, there are numerous reasons. This number can be negatively impacted if you bring on customers that end up spending less than what your average customers have spent in the past. This can also happen if customers don’t stick around as long, or worse, you have a specific interval with higher refunds. This type of LTV is living. It’s always changing, for better or for worse, hopefully for better. But should it turn the wrong direction, you’ll sure be glad you’re measuring it with Graphly so you can fix whatever is wrong before the wheels fall off.
Want to set up LTV in your account? Watch the video:
http://docs.graphly.io/article/260-lifetime-value
Interval Lifetime Value
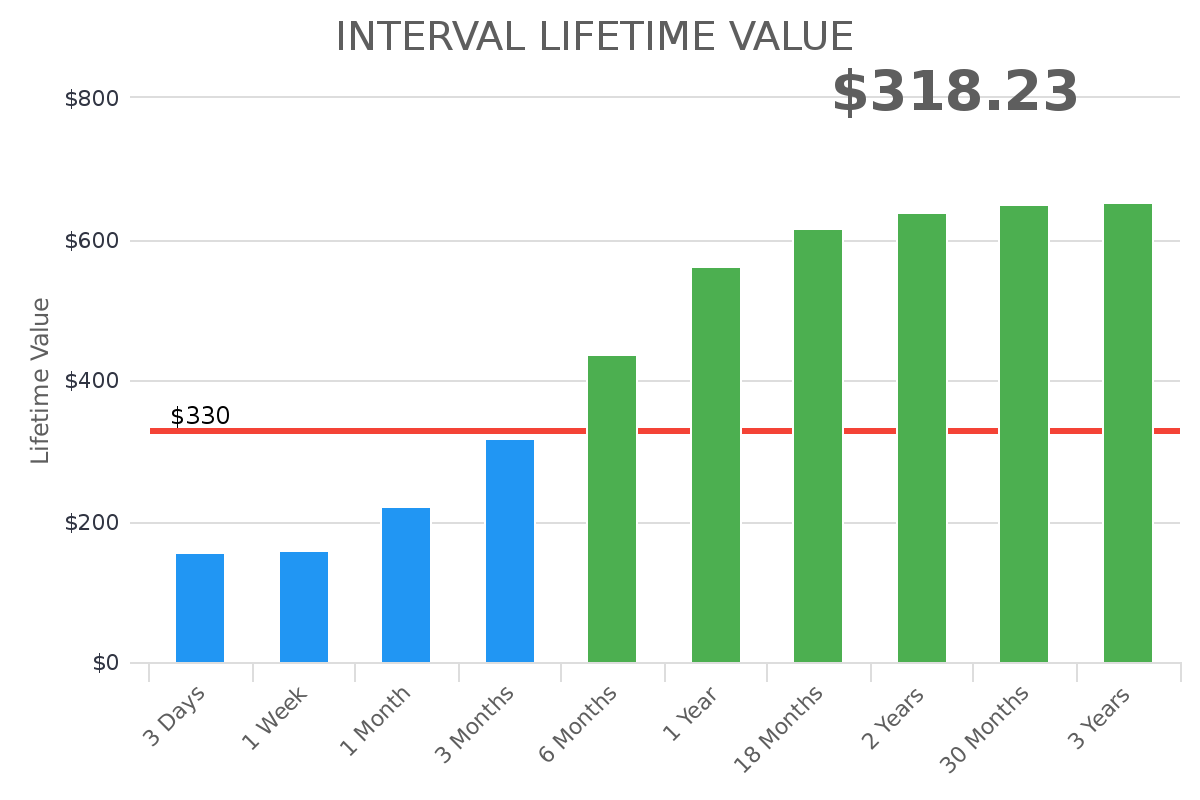
This report displays the lifetime value from the first day a prospect becomes a customer, and at other date intervals of your choosing. Let’s say you want to know how much a customer is worth to you the first day, week, month, year and two years. How long does it take to “break even”? How long does it take to double or triple the return on your investment (acquisition costs)? How long will you be out money? Cashflow is king. The chart above spells it all out for you, allowing you to make adjustments that result in a higher LTV in a shorter period of time. It helps you identify plateaus in your business-customer relationship so you can make tweaks and improvements that increase loyalty, increase satisfaction and ultimately increase spend.
Want to set up Interval LTV in your account? Watch the video:
http://docs.graphly.io/article/259-interval-lifetime-value
Transactional Lifetime Value
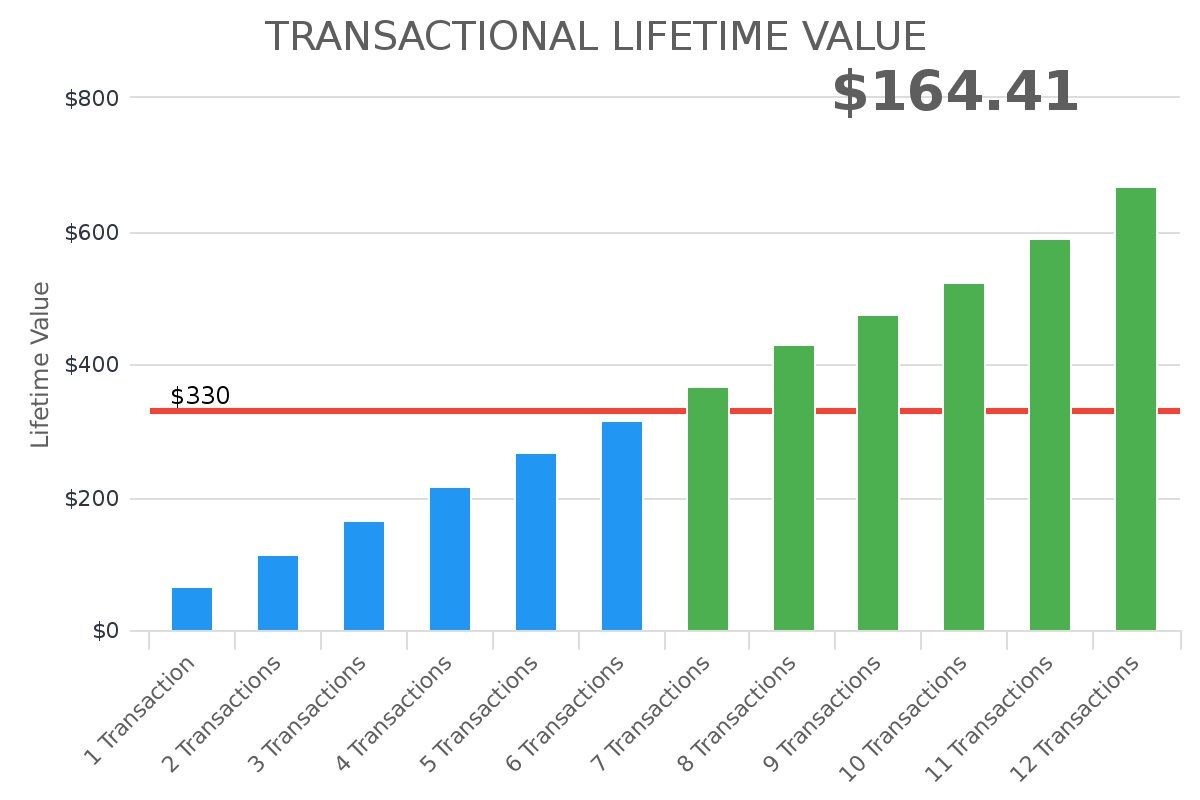
This report displays the lifetime value from the first day a prospect becomes a customer, and at subsequent purchases of your choosing. Let’s say you want to know how much a customer is worth to you when they’ve made 2 purchases, 3 purchases or even 10 purchases. For some organizations, there’s a transaction barrier. When you are successful in surpassing this barrier, the customer becomes exponentially more profitable because they begin to spend significantly more with you. Regardless of what you deem “front end” versus “back end”, Graphly will help you understand where that threshold really lies so you can adjust your systems and processes accordingly. As you can see in the chart above, you also have the ability to include a break even line so you can see at which transaction you become profitable and how long it takes double or triple the return on your investment (acquisition costs).
Want to set up Transactional LTV in your account? Watch the video:
http://docs.graphly.io/article/261-transactional-lifetime-value
Subscription Lifetime Value
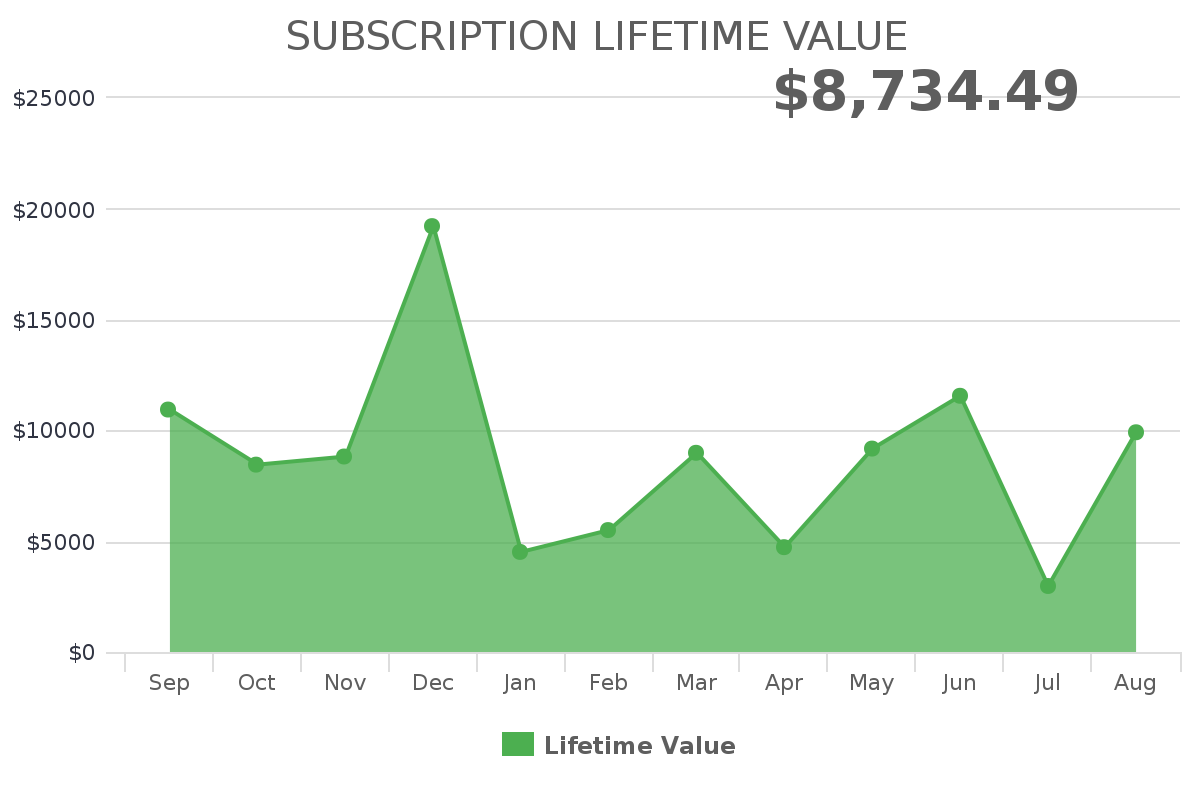
Subscription LTV moves away from historical data entirely, and is 100% predictive in nature. This report takes into consideration cancellations, active subscriptions and average price to project future revenue. Having this figure helps you determine how much you can spend to acquire a customer. As you increase your LTV, you can increase your budget to acquire new customers, outspend competitors and win market share. Savvy business owners also use this report to understand how long into a subscription customers are canceling, so they can make adjustments in customer service to increase loyalty and satisfaction before that moment of cancellation occurs. And you guessed it – by doing so, they retain the client longer which results in an overall increase in LTV.
Want to set up Subscription LTV in your account? Watch the video:
http://docs.graphly.io/article/157-subscription-lifetime-value
How To Increase Lifetime Value
Would you like to boost your LTV? Awesome! Doing so is a noble pursuit that will positively change your business forever. Increasing LTV means higher profits, plain and simple.
According to Marketing Metrics, the possibility of selling to a new prospect is 5-20%, but the probability of selling to an existing customer is 60-70%. By focusing on returning customers — their lifetime value — you are focusing on a strategy that gives your business higher profit margins.
Here’s how to go about increasing your LTV:
- Increase Average Order Value:
The quickest way to do this is increase your prices. You can literally make the decision today, and assuming you’ve already done testing to find out where your price elasticity is, you could begin increasing LTV tomorrow. Now, for those who find themselves at the price ceiling in their industry or lack the demand for their products or services that would justify a price increase, there are other ways to increase the average order value. Upsells. Hopefully I don’t need to go into detail here since we’ve all been asked, “would you like to super size that?” Whether it’s a larger size, multiple quantities or introducing additional offers that complement the initial product or service, upsells are golden. If you’re taking orders online, FixYourFunnel has a slick, one click upsell application that can make this process easy peasy for you. - Increase Repeat Purchase Rate:
Implement customer loyalty programs, punch cards, promotions and more to get customers to transact with you more frequently. - Increase Customer Satisfaction:
One of the most effective ways to boost LTV is to increase customer satisfaction. The longer a customer is a customer, the more he or she will spend. In the famed Harvard Business School Report, researchers discovered that a 5% increase in retention rates translates into 25-95% improvements in profit!
Net Promoter Score® (NPS®)
Speaking of increasing customer satisfaction, that means you’d have to first measure it to establish a baseline. I’m wondering if any of our users would like to see us add an NPS report to our library. If you’d find that helpful, let us know in the comments section below. If we get 6 or more “votes”, we’ll take a serious look at squeezing it into our product road map.
One more thing to consider…
Using Criteria Builder to Maximize ROI
Since the cheapest leads aren’t always the best leads, companies should be aware of the lasting effects of acquiring “cheap” customers. How much do these customers spend? How many times do they transact with you? How frequently? How long do they stick around? Sometimes it pays to invest in “good” customers. While “good” customers can cost more to acquire, they usually end up being more profitable.
Final thoughts…
Q: What can I spend on ads? A: Check your lifetime value.
Q: How much can I commission my salesperson? A: Check your lifetime value.
Q: When will we break even on our initial investment? A: Check your lifetime value.
Q: How much customer service is too much service? A: Check your lifetime value.
Lifetime Value Is The Answer You’re Looking For!
Happy Charting!