
Growth – a goal of almost every business, ought to be measured if it is to be realized. With today’s product update, we’re releasing 3 new reports designed to measure growth.
There are two ways to measure the growth of a list, a tag, or a subscription.
- The first approach is based on interval performance. With this approach, you see the performance of each interval, independent of previous results and comparative to the interval before it and after it. Graphly report templates that allow you to do this include: Leads, Tags Applied and Subscriptions Started (among others).
- The second approach is based on accumulation, or a running tally of results. Each interval is either adding to the previous interval to achieve an accurate total for each interval in time.
Let’s look at an example using lead generation. It’s January 1st, 2017 and we have a list size of 10,000 contacts. For the next six months we measure our lead generation efforts.
Here are the results:
Jan: 980
Feb: 800
Mar: 1210
Apr: 650
May: 730
June: 940
Compare Option 1 (which has been available via Graphly for quite some time) to Option 2, which we’re releasing today.
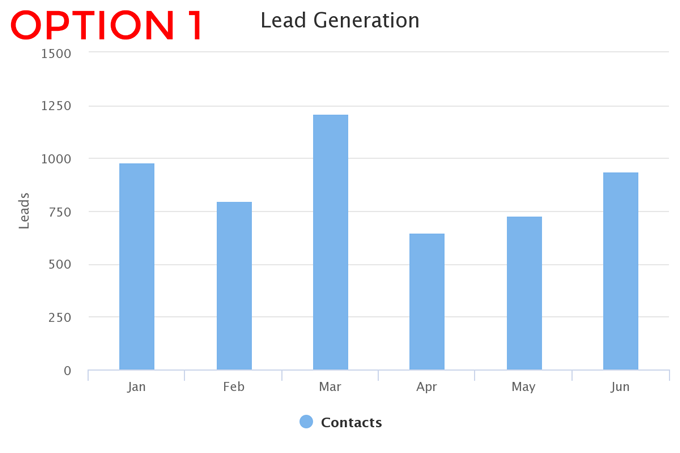
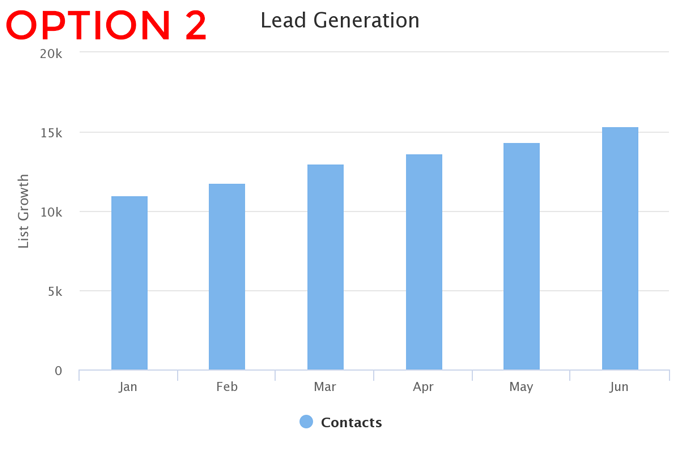
Do you see the difference? Both charts are utilizing the same data but in the first you see the up and down results of each interval where as in the second you see the overall trend (consider this the big picture view). Another way of looking at it is that the first focuses more on the new additions to the list where as the second focuses on the size of the list as a whole.
With that in mind, let me introduce you to our new reports designed specifically for measuring growth.
Measuring Growth of Contacts
List Growth
The new report “List Growth” shows you the growth of your contacts over time.
Measuring Growth of Actions
Tag Growth
The new report “Tag Growth” shows the growth of your contacts with selected tag(s) over time. As with all tag reports, do to the nature of tags, this report can be used in so many ways. Any process, step or call to action where you’re applying a tag can be measured. “How many demos did we deliver last month? What about the month before that?”
Measuring Growth of Subscriptions
Active Subscriptions
The new report “Active Subscriptions” shows the number of active subscriptions over time and the revenue associated with those subscriptions. Want to know where you are today versus where you were 3 months ago? 6 months ago? 1 year ago? No problem.
Have a play with these new reports. They’re incredibly easy to configure. We hope you’ll put these new reports to great use to monitor and drive growth in your business.
Happy Charting!
P.S. Deletions & Removals
Keep in mind that if you delete contacts from your database, it’s as if they never existed (in any interval). The same is true with tags. You should be applying (and never removing) historical tags for reporting uses. Status tags can be applied and removed freely but are rarely used in reporting. Lastly, when a subscription is inactive, it is best to leave it inactive as opposed to deleting it. Deleting a subscription would cause the report to treat it as if it had never existed. There are certainly scenarios where deleting is necessary (bogus info / spam bots, etc.), and there are scenarios where it’s better to leave the record present but tag it appropriately. Just know that your decisions with how you handle records will certainly impact the data returned in your reports.