Over the last decade we’ve helped countless businesses with their sales pipelines. In this post we’d like to share some of the things we’ve learned in crafting our own opportunity funnels and helping others get the most out of theirs.
I WANT TO SKIP THE EDUCATION – JUST SHOW ME YOUR NEW REPORT
Stage Purpose
Your opportunity funnel stages act as both building blocks and milestones — they allow you to structure and measure the sales process. For an opportunity funnel stage to be meaningful or effective, it must be defined by measurable activities. Otherwise, one stage blurs into another, and the sales process will no longer be a useful tool for measuring conversions.
In short, a sales stage is simply a status marker that shows the level of engagement a buyer has had with your sales team. These stages are the cornerstones of a reliable sales process and are an indispensable foundation for every sales team.
How Many Is Too Many?
This is the age-old question for Sales VPs, Directors and Managers alike when first designing their sales process: how many opportunity funnel stages should I have?
While there’s no single answer that’s right for every business, there are a couple of industry benchmarks that you can rely on when mapping out your sales funnel. Most sales experts agree that:
- Having 2 opportunity funnel stages is not enough. The buyer’s journey is only a journey if there’s some kind of progression. As much as we all love a “cherry” lead, it’s very rare for a buyer to find out about your product (stage 1) and then immediately be ready to buy (stage 2). No matter your industry or team, two opportunity funnel stages is just not enough to provide meaningful insight.
- Having more than 6 opportunity funnel stages is too many. At that point, the process becomes too diluted, and there isn’t real meaningful drop-off or difference between each stage. The progression from stage 6 to stage 7 is likely to be a small change. In other words, if moving an opportunity from one stage to the next doesn’t really feel like the deal has made much progress, those two stages are likely a single stage. Consider combining them.
Now that we know 2 stages is too few and that more than 6 is too many, we’re making progress. It seems like the sweet spot for most sales organizations is between 3-5 opportunity funnel stages with 4 and 5 being most common. Once you’ve identified the critical steps in the buyers journey, it’s time to consider exit criteria for each stage.
Exit Criteria
What is exit criteria? Think of it as requirements that must be met at a particular stage in order for the buyer to be moved to the next one. If you’re using Keap, exit criteria could be incorporated with the Stage Checklist feature.
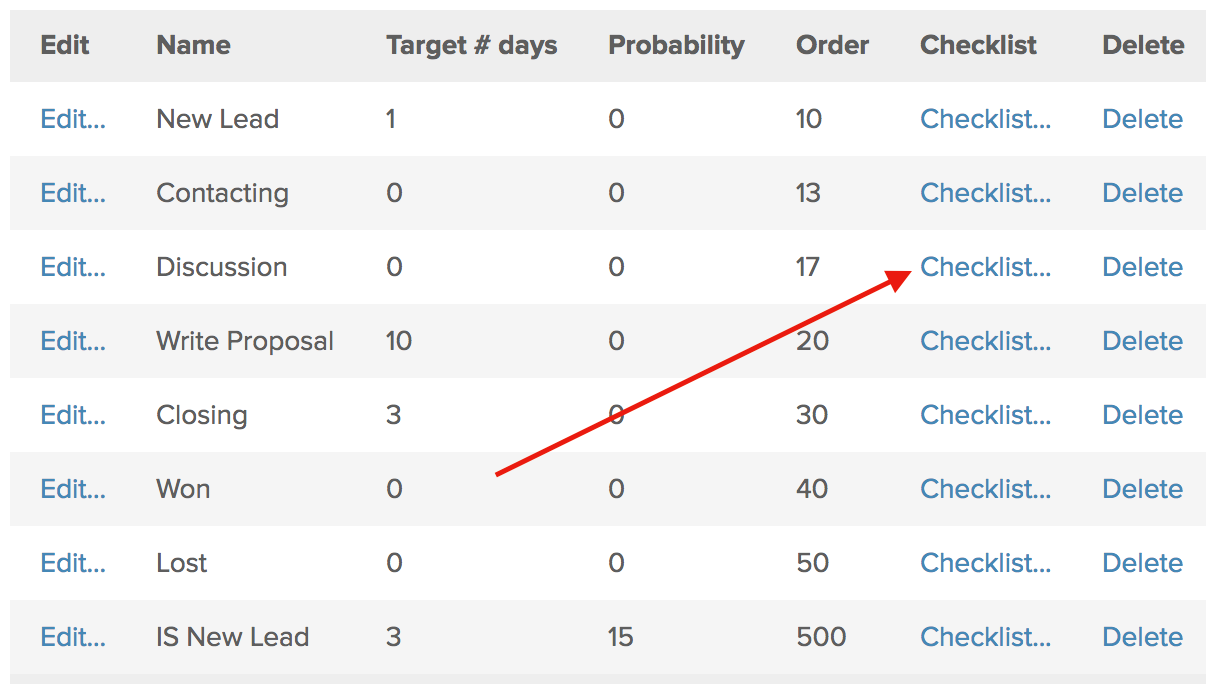
For instance, at stage 2, the requirement might be the signing of a Non-Disclosure Agreement. Or, at stage 3, the buyer must sit through a one-on-one demo with a sales rep. Clarifying this criteria will crystallize the progression and the drop-off between stages.
You wouldn’t expect to see a buyer in stage 4 of your opportunity funnel pipeline if an NDA wasn’t on file and a demo hadn’t been held.
If/when you see an opportunity funnel stage that has significantly higher drop-off than other stages, it’s usually a result of one of two causes:
- Your sales team struggles when it comes to helping buyers meet the exit criteria for that particular stage. This can quickly be remedied with training. Hint: look at your top performers (highest converters of this same stage) and see what they’re doing differently from everyone else.
- Your exit criteria is too strict. Reconsider if the requirements are really necessary or if they can be altered or adjusted in some way. While the process of disqualifying the wrong buyers is important, be careful not to over disqualify buyers who would otherwise be great customers.
Size Matters
The size of your pipeline matters, or at least that’s what the world will tell you. Conventional sales wisdom instructs that a 3x (or more) sales pipeline-to-quota ratio is absolutely necessary for any team to realistically hit its targets. This archaic line of thinking suggests that in order to produce $1 of revenue, a rep must have a pipeline of $3.
Extrapolating the ratio, a company would need a pipeline that is valued at $3MM in order to meet a quota of $1MM.
Is the 3x ratio a data-backed rule or is it simply the product of a “that’s how it’s always been done” mentality?
To make matters worse, some companies looking to increase quotas simply demand ever more pipeline, pushing the ratio up to 4x, 5x or more. The endless demand for more – more revenue! more pipeline! – is a dead giveaway of a failing sales philosophy.
In reality, it’s not just the size of your pipe that matters, it’s what you do with it.
Improved Conversion Rates
Instead of stressing over how to increase the sales pipeline (usually a function of marketing) in order to meet quota, sales managers should focus on what they can control…conversion. How does one go about increasing sales conversion?
- Measurement: You can’t improve what you aren’t measuring. Look at the opportunity funnel of each sales rep. What are the conversions rates between each stage? Where are the weaknesses in a sales rep’s selling process?
- Coaching: This kind of coaching is different than what you’re used to. We’re not referring to general training topics that get delivered to the entire team. When you measure and study the opportunity funnel of each sales rep intently, you will find salient points for analytical sales coaching.
For Example:
If a sales rep has low conversion rates at the beginning but is able to close a majority of opportunities that make it to the end – perhaps he or she could use help with better hooking the prospects attention. If the inverse is true – where a sales rep is converting extremely well through the first 4 stages of the sales funnel, only to see a dramatic drop off at the end, perhaps he or she is negotiating poorly.
Just like good health sometimes requires more than generic vitamins, but rather certain prescriptions, your sales team will perform far better when general training is complemented with one-on-one, needs-specific training.
Ultimately, if every rep was able to double their output and improve their ratios by 2x, then sales organizations would only need a 1.5x sales pipeline-to-quota ratio, right?
While such substantial improvement – and subsequent decrease in necessary sales pipeline – is unrealistic, marked improvements in the conversion rates of sales reps is highly attainable. Sales managers simply need to study the data more closely and spend more time delivering the right coaching to the right reps.
Opportunity Funnel Report
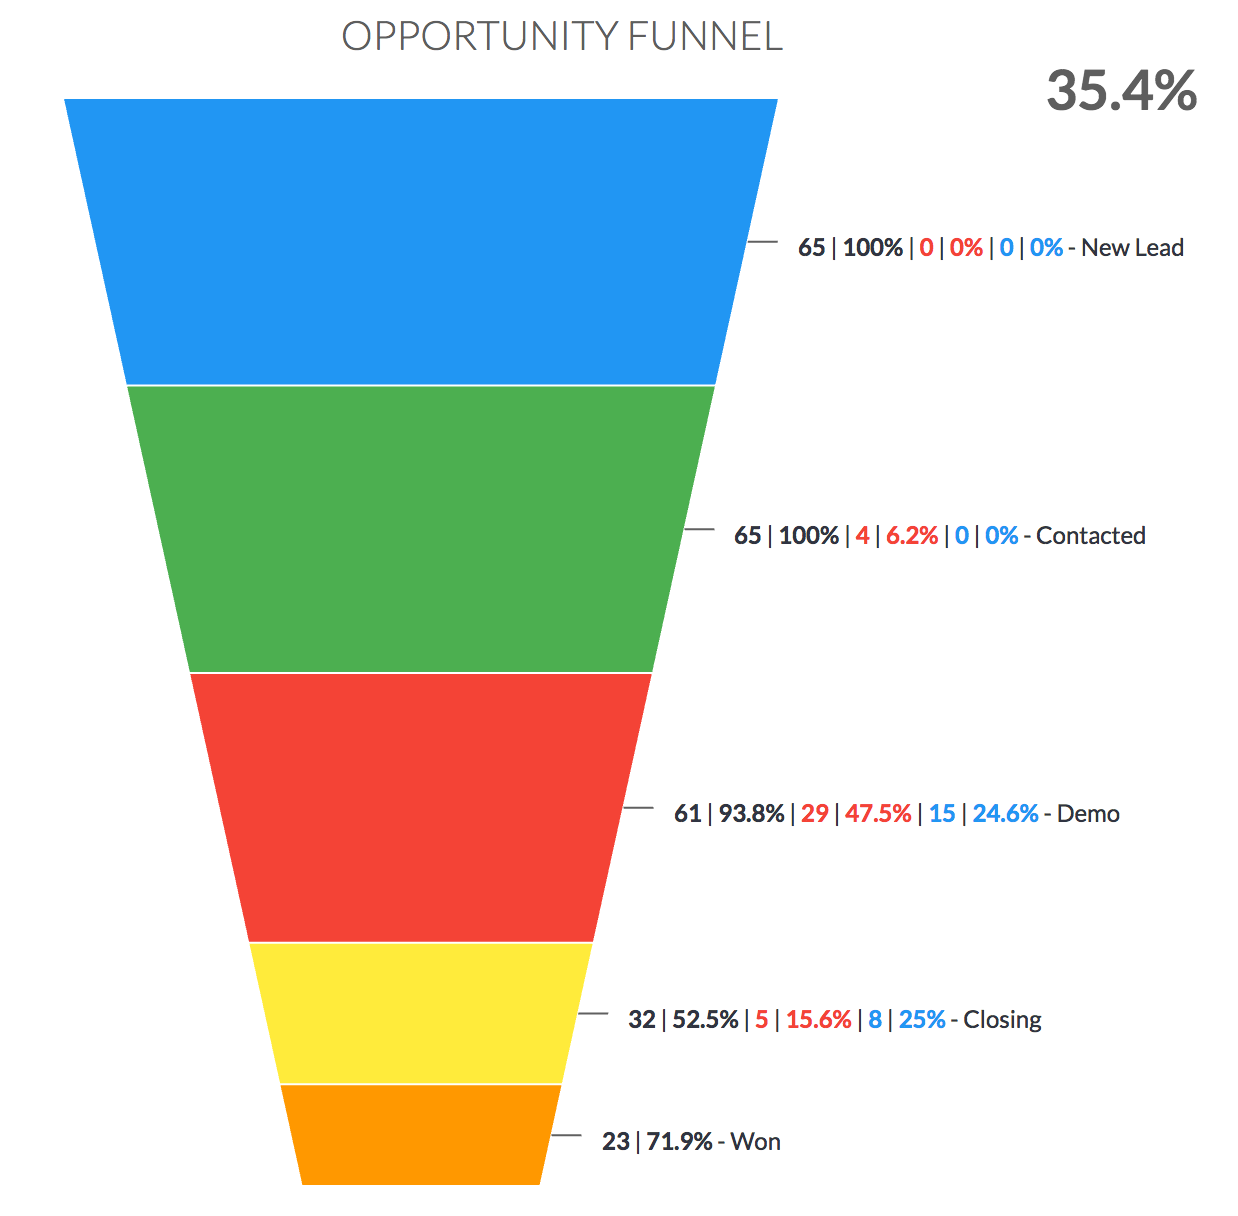
Whew! Okay, with that foundation in place, we’d like to show you what we built to help measure pipeline conversion. We call it the Opportunity Funnel.
Insights from the Opportunity Funnel Report
- # = The number of opportunity records that passed through a stage
- % = The conversion of opportunities in the current stage from the previous stage – this allows you to see bottlenecks in your pipeline where progressing an opportunity is a challenge
- # = The number of opportunities that move from this stage immediately to the lost stage
- % = The percent of opportunities that move from this stage immediately to the lost stage – this reveals leaks in the pipeline, something about your sales process causes the opportunity to be disqualified or causes the prospect to lose interest in your offer
- # = The number of opportunities that move from this stage immediately to the won stage
- % = The percent of opportunities that move from this stage immediately to the won stage – this reveals how often you’re able to win opportunities with out them going through every stage in your pipeline
- % = The total conversion of your pipeline – the top right of the chart shows you the percentage of all of the opportunities who enter your pipeline that get moved into the closed – won stage
Recommendations
This report can (and should) be used in numerous ways. Here are just a few we recommend:
- Create an Opportunity Funnel report that represents all opportunities for a given time frame
- Use our ‘Copy Widget’ (blue) to create a similar report, but in Criteria Builder choose an individual sales rep
- If you have a sales team or multiple sales teams, repeat the previous step, this time selecting the sales reps of a particular team with in Criteria Builder
- As you begin to work on problem areas in your pipeline, create Opportunity Funnel reports with new date ranges as opposed to editing the existing dates. This will allow you to put the two funnels side by side and see the improvements your team or an individual sales rep has made.
- Make sure you also add our Days Between Opportunity Stages report to this same dashboard. Sometimes bottlenecks present themselves in the amount of time it takes to progress an opportunity from one stage to the next. In other words, your conversion from stage 3 to stage 4 may be high, but it may be taking you 3x as long as you thought it was. Shortening up that timeframe will bring the same amount of deals through the door, only sooner. This ultimately allows you to reinvest in lead generation more frequently. Advertising dollars that would usually be reinvested 4x a year, can suddenly be reinvested 12x a year, essentially 3x’ing the annual lead gen
Want to see more?
Visit our knowledge base to see just how easy this report is to set up: http://docs.graphly.io/article/350-opportunity-funnel
Happy Charting!
Jarrod