
In our report template library we already had New Subscription Revenue, which is a gauge that is great in comparing new subscription revenue to a goal you’ve set. We also have a subscription counter which gives you a number of new subscriptions for the timeframe you chose and compares it to your average, best and previous timeframes performance.
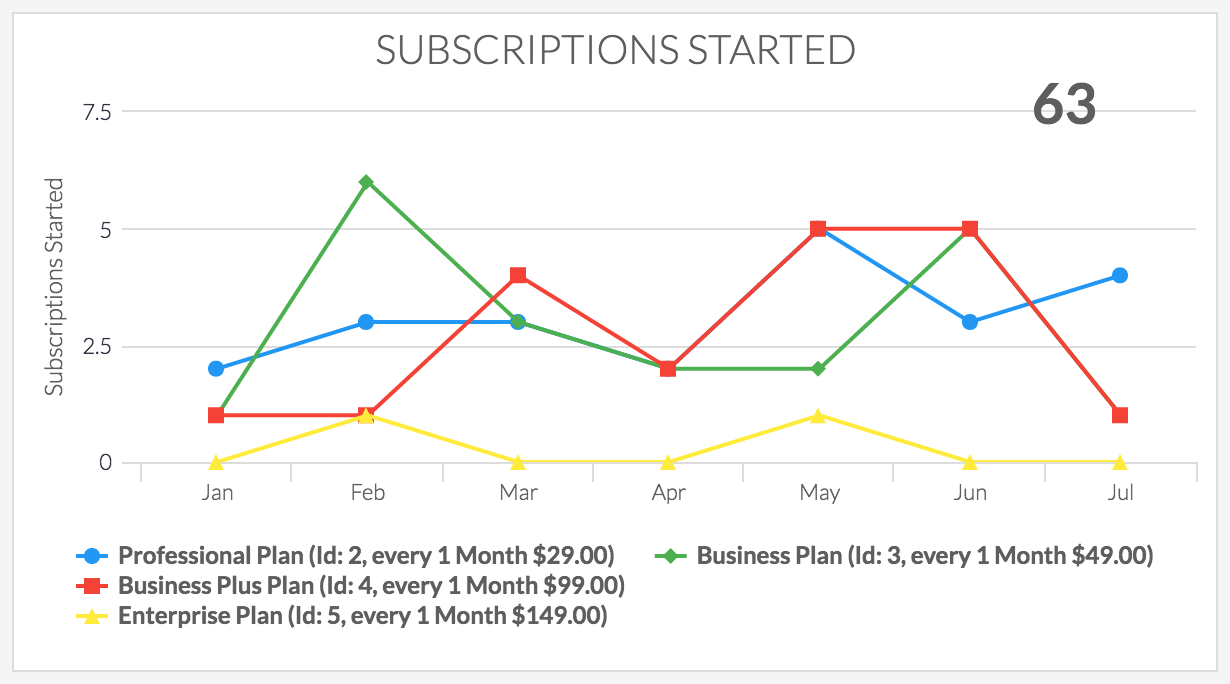
Subscriptions Started
This report finds itself uniquely different from the 3 reports above. It allows you to see the number of subscriptions that have started over a given date range. This data is especially helpful for those who are striving to sell a baseline number of subscriptions every week or month, or better, trying to track the growth of subscription sales over time.
You can set it up in 3 minutes or less! See the video tutorial and follow along!
Happy Charting!
Team Graphly