
Some how we managed to leave 13 years of education with out knowing how to create a balance sheet, read an income statement, build credit orhaving any idea about real estate, the stock market, retirement plans or a magical number, 72. Forget about entrepreneurship or anything related to running a business.
But I’ll save my rant on our broken education system for another time…
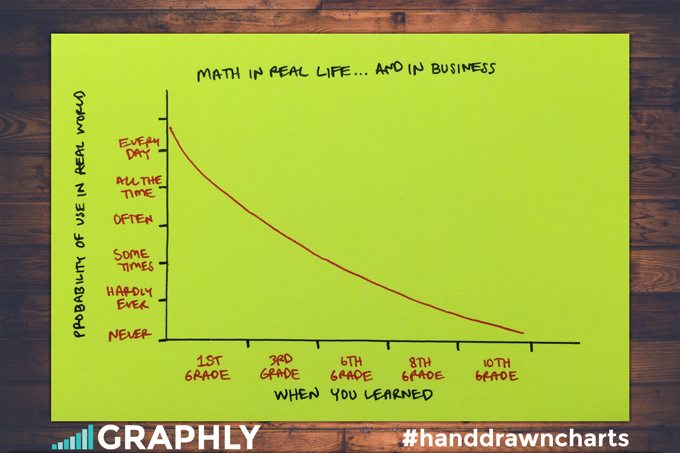
The point is, as a society we are producing for the most part, financially illiterate individuals. In my previous (Hand Drawn Charts) post on getting the most pizza for your money, I conceded that the ability to remember a little algebra from your school days could be quite advantageous (to both your wallet and your stomach). All joking a side, to be successful in business, one must be successful in math.
Simple Math
Now before you freak out and say, “but I hated math in school,” or “I seem to be doing just fine with out math,” take another look at the chart above. It’s not the complex math from High School that you need to recall. No, leave Trigonometry and Calculus to those whose fields require it. Rather, it’s stuff you learned in the 1st, 2nd and 3rd Grade. Principles like “counting” and “comparing” (two numbers to each other in order to determine which is larger, and which is smaller).
Examples:
Cost Per Lead (CPL) vs Value Per Lead (VPL) (VPL > CPL = WINNING)
Customer Acquisition Cost (CAC) vs Lifetime Value (LTV) (CAC > LTV = LOSING)
See what I did there with the ‘greater than’ signs? Hopefully you haven’t forgot that the ‘>’ symbol means greater than ;).
Even if you did, there’s no need to fret. Graphly does all of the heavy lifting for you. Again, all you have to do is compare. Here’s another comparison for you.
How many leads did we produce last week? How many leads did we produce this week? Is that a decline or an improvement? Any one can do that kind of math, right?
Question: If it’s that easy to compare, why do so many business owners not do it? Answer: Time. Graphly takes a process that is usually quite time consuming, and makes it easy to access, anytime, anywhere, on any device. It’s so easy, my 3rd grader could make highly intelligent business decisions, just by looking at the numbers on a Graphly dashboard.
Lazy Math
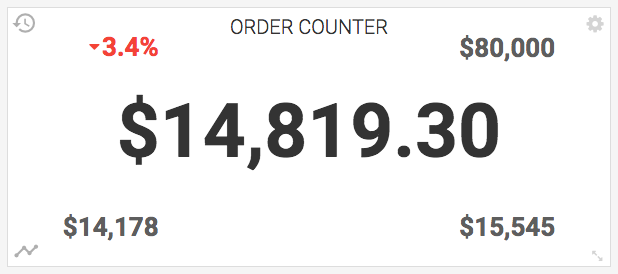
Feeling lazy? Graphly has reports we call counter widgets that calculate your performance for a given date range, compare it to the equivalent interval of time that preceded it, and display the rate of change accompanied by either a green positive triangle (increase) or red negative triangle (decrease). No math required on your part. Just a one second glance and you immediately know if things are getting better or worse.
In summary, entrepreneurs, marketers, sales people… we’re in the arithmetic game. You don’t have to be a math wizard to be successful in business, but on the flip side of that coin, you simply can’t afford to ignore the numbers. Ignoring the numbers doesn’t make them go away. They still exist. And thank goodness too!
Living Math
You see, your business is a living, breathing entity. It’s literally telling you what it needs to grow. More often than not, the problem is that you’re just not listening. You’re just not looking. You ignore the numbers (probably because of some traumatic school experience that left you scarred and thinking math was evil).
Numbers are beautiful. Math is good. Whether you choose to do the math old school with paper and pencil, maybe even a blackboard, or whether you want to leverage a simple yet powerful tool like Graphly to do the math for you, do the math. Give the numbers the attention they deserve because they’re here to serve you and help your business grow.
Happy Mathing!