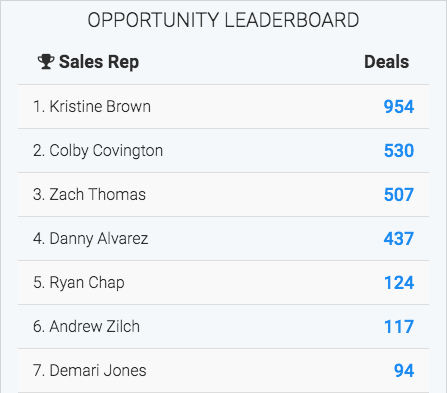
Today we’re releasing 3 new sales leaderboard reports for teams using Keap Opportunities to sell products or services. Here’s a quick look at one of the reports:
But before I dive into the reports themselves, let me tell you about the time I worked at Keap (now Keap) in their sales department.
Back then the sales force was just a fraction of what it is today. It included: Cody, Dan, Larry, Kristy, and the newest member – me. We were a small team but we were responsible for producing a crap-ton (official measurement) of revenue. That’s back when Keap had a required $5,000 setup fee, along with other optional upsells. Every new customer was worth north of $8600 in just their first year.
One day our manager called a sales meeting to show us his newest creation – a sales leaderboard. On the wall was a chalkboard…I’m just kidding, I’m not that old…on the wall was a whiteboard with all of our names neatly listed on the left, and on the right, was the total revenue each of us had brought in.
Wouldn’t you know it – the top earner was positioned at the top of the board, with everyone else sorted in descending order. I fell dead-middle of the pack. Not the highest, but not the lowest either (thank heavens I sighed with relief upon seeing the board).
Sales Leaderboard Results
Over the next few months, we all jockeyed for the top position more fiercely than any of us had before. And while the #1 spot shifted from week to week and month to month, something amazing happened – our collective sales went through the roof as we each improved our personal performance. The sales leaderboard acted as a high tide, that raised every ship on the sea.
Allow me to elaborate on what had occurred. We had no additional leads coming in. We weren’t running promotions or discounts. We weren’t working longer hours (okay, maybe we were working a little extra, but by choice, because we each wanted to be at the top of the sales leaderboard). The only thing that had changed was that we were all keenly aware of our performance, publicly. I could see the performance of my co-workers, and they could see mine.
If you want to create some friendly competition while simultaneously growing your revenue, just put up a leaderboard. Oh, and don’t worry about hanging that whiteboard, spending hours creating a grid on it with thin black tape, and updating it manually all through out the day as sales are made. We got you! Do what other Graphly users have been doing for years and hang a TV in your office with a sales dashboard showing off the most important sales stats.
Sales Leaderboard Overview
I just shot this quick video to walk you through some scenarios of how to use these reports. Check it out!
Opportunity Leaderboard
This sales report shows a leaderboard, sorted by users and the number of opportunities assigned to them during a specific date range. Select any stage or multiple stages to depict a specific area of your sales pipeline.
See the Opportunity Leaderboard Help Doc
Opportunity Revenue Leaderboard
This sales report shows a leaderboard, sorted by users and the total revenue of opportunities assigned to them during a specific date range. Instead of counting records, this leaderboard report sums the revenue of those opportunities.
See the Opportunity Revenue Leaderboard Help Doc
Average Deal Size
Would you rather sale five $1000 customers or or ten $500 customers? Most savvy businesses we work with know that the higher they can drive their average deal size, the higher the overall revenue will be. E-commerce companies often refer to this as AOV (average order value). Use the Average Deal Size Leaderboard report to show the average revenue of opp
See the Average Deal Size Leaderboard Help Doc
Tag Leaderboard
While our tag leaderboard has been around for a while, you might not have thought to use it to rank the results of your sales people. Here’s a quick example of how you can use the tag leaderboard report to produce a sales leaderboard that ranks sales people based on activity.
First create tags to identify key activities: emails, calls, demos, appointments, meetings, etc. If you were looking at initial meetings for example, you’d create the following tags:
- Initial Meeting – Cody
- Initial Meeting – Dan
- Initial Meeting – Larry
- Initial Meeting – Kristy
- Initial Meeting – Jarrod
Each time Cody, Dan, Larry, Kristy, or Jarrod hold an initial meeting with a prospect, their respective tag is applied to the contact record. After setting your date range to calculate results for the day, week, month or quarter, you’ll see who’s putting forth effort filling their pipeline by holding initial meetings with new prospects.
* Keep in mind that tags can only be applied once to a contact record unless it is removed. So this approach is best utilized when a contact only goes through a certain activity a single time. Otherwise, you’d need to use something like Note Records for measuring activity that repeatedly occurs with the same contact.
See the Tag Leaderboard Help Doc
In Closing
Using a sales leaderboard will increase the number of deals you close! If you’re an active Graphly customer, log in to your account to set up multiple leaderboards with just a few clicks. Not a customer? Get Started Here
Yes!!! We’ve been needing something just like this to light a fire under our team. These leaderboards will be going up on a big screen right next to our sales floor. Thanks again!