The Average Deal Size Leaderboard report shows a leaderboard, sorted by users, and the number of Opportunities assigned to them.
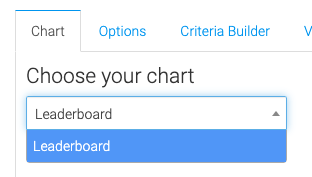
Chart Tab
The only display type for this report is Leaderboard.
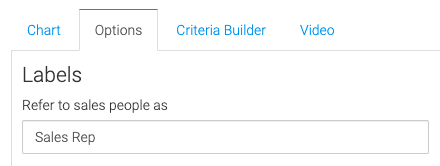
Options Tab
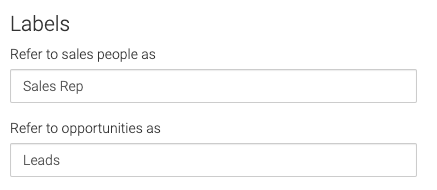
Enter a label for what you call members of your sales team. Sales Rep, Sales Person, Team Member, etc.
Enter a label for what you call your Opportunities. Leads, Sales, Deals, etc.
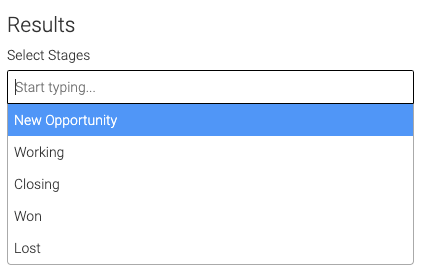
Select the sales stages you want to display data on.
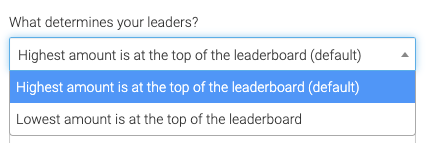
Choose how you want the leader to be determined.
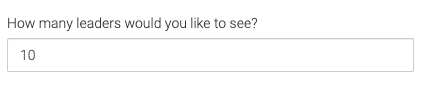
Set how many leaders you would like to see (50 maximum).
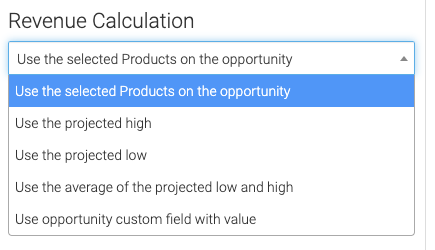
Select how you want the revenue to be calculated.
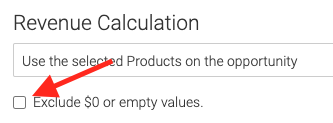
Choose whether you want to exclude $0 or empty values from the field selected in the previous step.
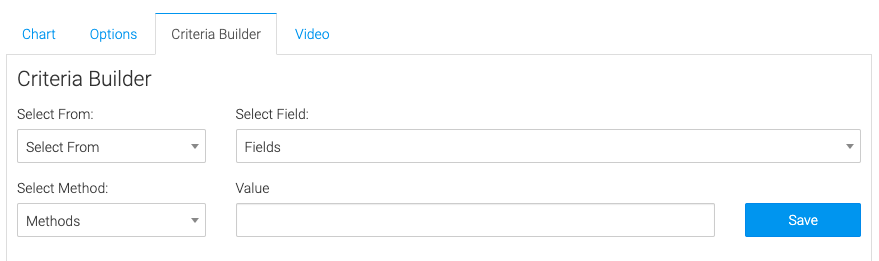
Criteria Builder Tab
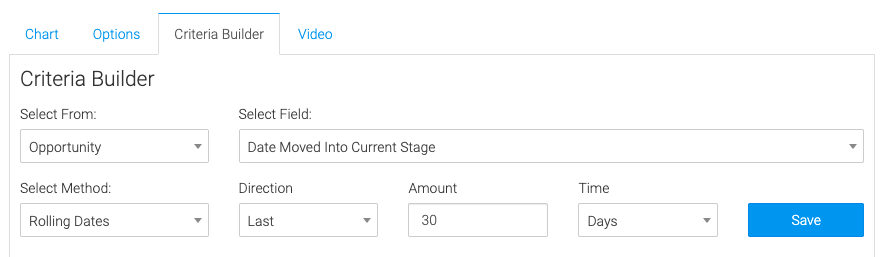
For Ultimate control and customization, use the Criteria Builder to set additional rules and requirements for the report.
Using the criteria builder will also allow you to set a date range restriction. For example, you could select Opportunity >> Date Moved into the Current Stage >> Rolling Dates >> Last 30 days. This will only allow opportunities that have been moved to their current stage in the last 30 days.
Relevant Articles to Average Deal Size Leaderboard
- How to Set Up the Tag Leaderboard Report
- How to Set Up the Contact Leaderboard Report
- How to Set Up the Opportunity Funnel Report
Try Graphly for Just $1!
Unlock the full potential of your data with Graphly! Sign up for our 14-day trial for only $1 and gain access to a wide range of powerful reports designed to help you make data-driven decisions. Here are some of the reports you can explore:
- Opportunity Leaderboard: Track and analyze your team’s performance.
- Gross Revenue: See the money coming into your Keap account over time.
- Opportunity Forecast: Forecast the adjusted revenue of active opportunities based on the stage probability.
- Units Sold: See the number of units sold for each product you select over a given date range.
- Campaign Email Stats: Measure the impact and conversion of your marketing campaigns.
- Tags Applied: See how many tags get applied to contacts during a period of time.
Don’t miss out on this limited-time offer! Start Your 14-Day $1 Trial Now.