This template displays the revenue generated by each email in a campaign sequence.
Chart Tab
This report is best viewed as a column or bar. I’ll select column.
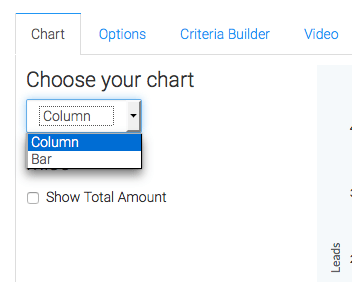
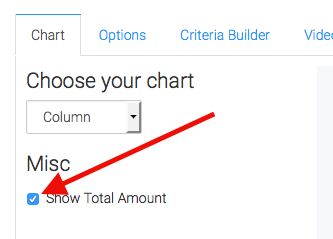
If you click the show total amount check box, Graphly will total the revenue generated by each email and display it on the top right-hand corner of the graph. This is ideal for rolling up revenues in order to measure the performance of an entire sequence. You may want to name this widget the name of the sequence in your campaign.
Options Tab
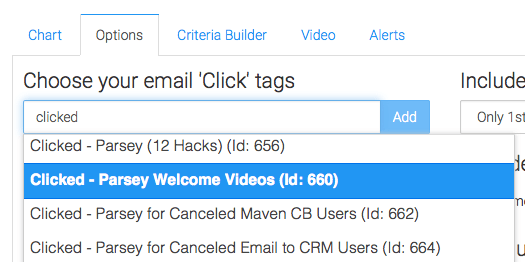
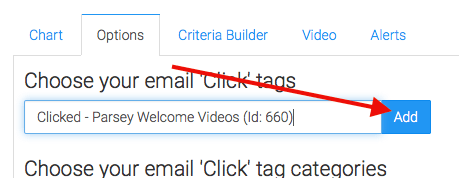
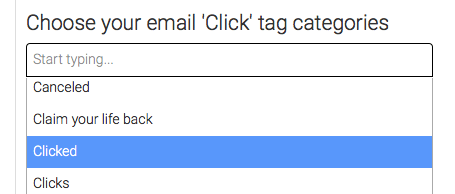
Now go to the Options tab. Add all of the emails that you wish to track by selecting their Click tags.
Next, select the tag category in Keap that houses all of your click tags. This helps Graphly loop through the data more quickly, giving you a snappy widget.
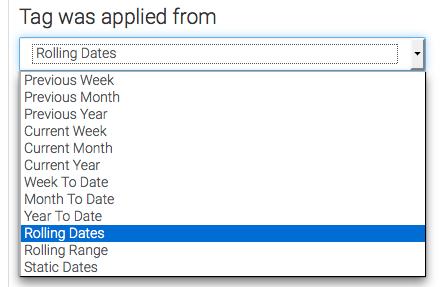
Now define the time frame you wish to look at based on when the click took place. Essentially, based on when the tag was applied.
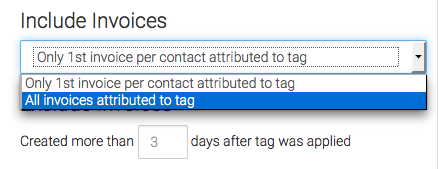
The next couple of settings are important as you can tell many different stories with this one report template. You can count revenue using the first invoice created after the click or you can count revenue based on all invoices after the click. At least until a new click has occurred.
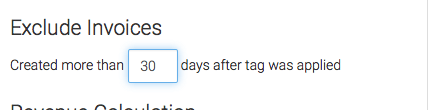
This next setting can greatly impact the way the graph displays. If you set this to one day, you will only see revenue that was brought in the same day that the click took place. If you set it to 30, you’ll see a much larger amount being attributed to a specific click. You decide what number works best for you.
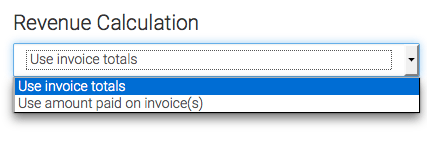
Next we define how the revenue is calculated. You can base it on invoice total or the amount paid on invoices.
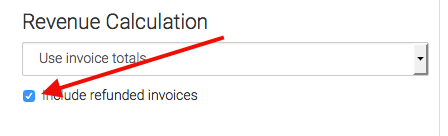
This final option allows you to include refunded invoices. By default, Graphly will exclude refunded voices.
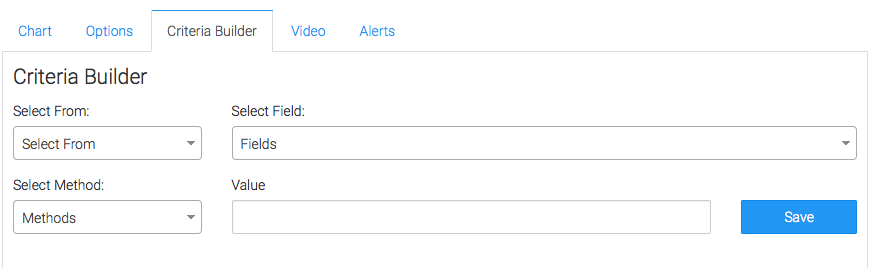
Criteria Builder Tab
For ultimate control and customization, continue using the Criteria Builder to include additional rules and requirements to the report.
Once you have your alerts set, click Save Preferences on This Widget.
Relevant Articles
- Setting Up Email Reporting in Keap’s Campaign Builder
- Campaign Email Stats
- Tracking Opens in New Email Builder (Beta)
Try Graphly for Just $1!
Unlock the full potential of your data with Graphly! Sign up for our 14-day trial for only $1 and gain access to a wide range of powerful reports designed to help you make data-driven decisions. Here are some of the reports you can explore:
- Opportunity Leaderboard: Track and analyze your team’s performance.
- Gross Revenue: See the money coming into your Keap account over time.
- Opportunity Forecast: Forecast the adjusted revenue of active opportunities based on the stage probability.
- Units Sold: See the number of units sold for each product you select over a given date range.
- Campaign Email Stats: Measure the impact and conversion of your marketing campaigns.
- Tags Applied: See how many tags get applied to contacts during a period of time.
Don’t miss out on this limited-time offer! Start Your 14-Day $1 Trial Now.