This report template returns the lead sources responsible for applying the selected tags of your choice.
Lead Sources By Tag Setup
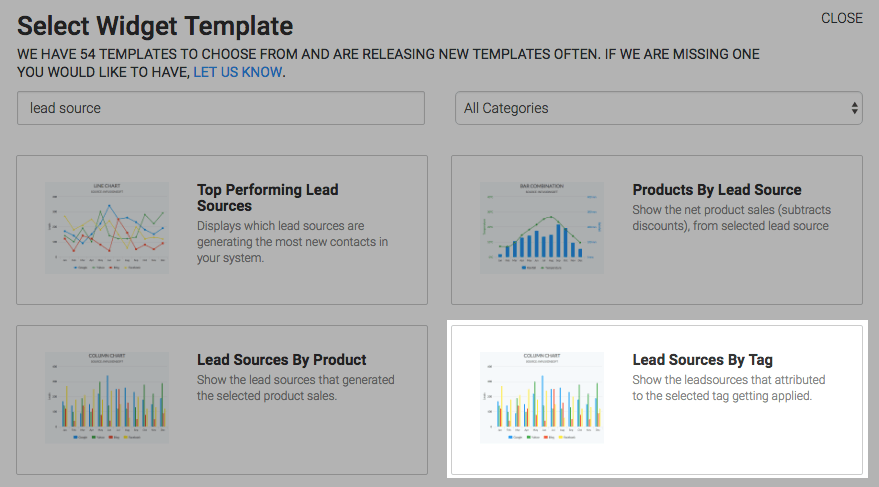
To begin, click the “+” icon on your Graphly Dashboard and type “Lead Source” into the search bar. Then select the “Lead Sources By Tag” template.
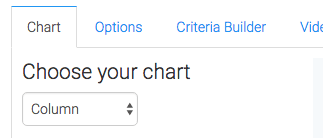
Under the Chart tab you will see that there are two chart types, column and bar. Pick either one according to your preference.
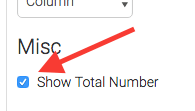
Checking the “Show Total Number” box will display the total number of tags applied to contacts in the top-right hand corner of the chart.
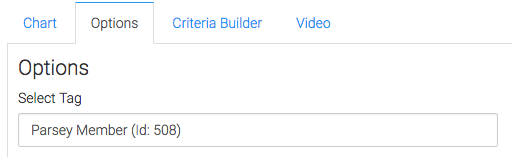
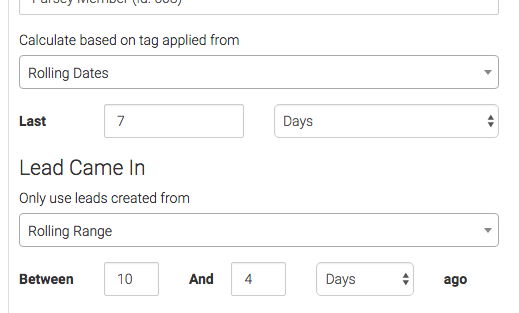
After finishing in the Chart section, click on the Options tag and select the tag that you’d like to base the report on.
Now select your date ranges that you want to collect the data from.
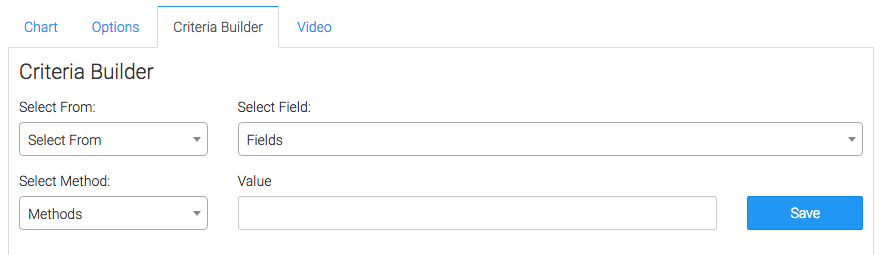
Criteria Builder
For ultimate control and customization, use the “Criteria Builder” to include additional rules and requirements for the report. This way you can filter out results based on any field in the contact record.
Once you have everything set, click “Save Preferences” on This Widget.
Now that you’ve set up this report, go ahead and check out how you can clean up your lead source data below. If you like our reports, help us out by giving us a good review on the Keap store!
Relevant Articles
Try Graphly for Just $1!
Unlock the full potential of your data with Graphly! Sign up for our 14-day trial for only $1 and gain access to a wide range of powerful reports designed to help you make data-driven decisions. Here are some of the reports you can explore:
- Opportunity Leaderboard: Track and analyze your team’s performance.
- Gross Revenue: See the money coming into your Keap account over time.
- Opportunity Forecast: Forecast the adjusted revenue of active opportunities based on the stage probability.
- Units Sold: See the number of units sold for each product you select over a given date range.
- Campaign Email Stats: Measure the impact and conversion of your marketing campaigns.
- Tags Applied: See how many tags get applied to contacts during a period of time.
Don’t miss out on this limited-time offer! Start Your 14-Day $1 Trial Now.