The Units Sold vs. Targets report displays the amount of units sold and the corresponding goal for each date range interval. This is a great report for sales teams that want to track their progress and goals over a longer date range.
Options Tab
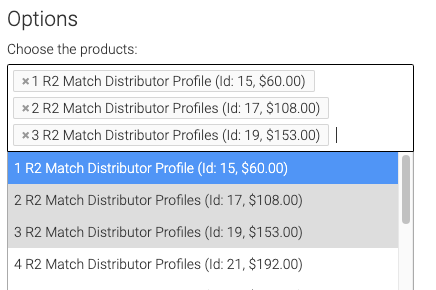
Products
Now navigate to the Options tab and select the products you would like to see from the products field.
Date Range
Select whether you want to use the date the order was created, or the Order Due Date.
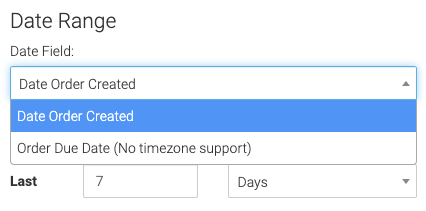
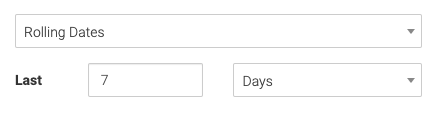
Now select the date range and interval you want to track.
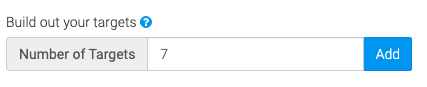
Targets (Goals)
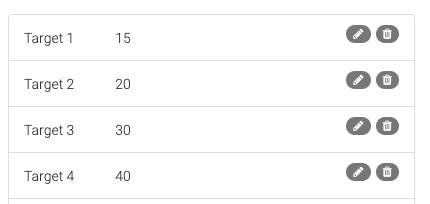
Select the number of Targets you wish to see. This should correspond to the number of intervals from your date range. Above, 7 days is selected, so you would want 7 targets. If 4 weeks was selected, you would want 4 targets.
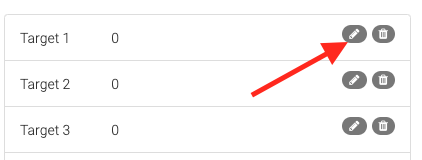
You can change the label and target number for each target by clicking the pencil icon.
Targets are organized by older sales in the date range being at the top, and newer sales being at the bottom.
Relevant Articles to Units Sold vs. Targets
- How to Set Up the Gross Revenue Report
- How to Track Product Unit Cost in Keap
- How to Set Up the Product Category Revenue Report
Try Graphly for Just $1!
Unlock the full potential of your data with Graphly! Sign up for our 14-day trial for only $1 and gain access to a wide range of powerful reports designed to help you make data-driven decisions. Here are some of the reports you can explore:
- Opportunity Leaderboard: Track and analyze your team’s performance.
- Gross Revenue: See the money coming into your Keap account over time.
- Opportunity Forecast: Forecast the adjusted revenue of active opportunities based on the stage probability.
- Units Sold: See the number of units sold for each product you select over a given date range.
- Campaign Email Stats: Measure the impact and conversion of your marketing campaigns.
- Tags Applied: See how many tags get applied to contacts during a period of time.
Don’t miss out on this limited-time offer! Start Your 14-Day $1 Trial Now.