This template displays the rate of revenue growth for each interval over a given date range.
Display Tab
In the Display tab, you’ll see that the only chart type is Bar Combo.

Settings Tab
Now let’s go to the Settings tab. Here, you’ll want to decide how we want to calculate the revenue.

Under the Invoice options you can choose between total invoice and total paid.

Now we need to select our date range for the report.

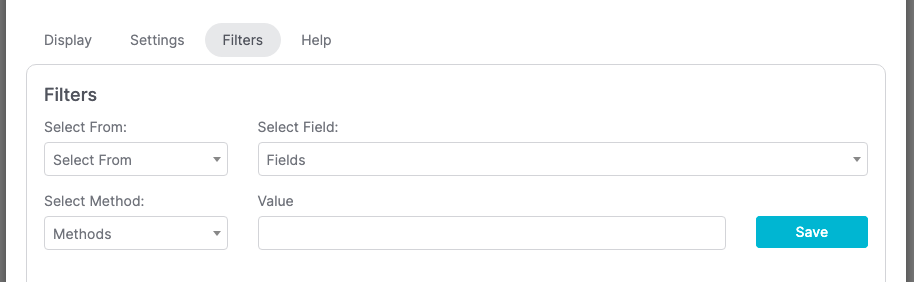
Display Tab
For ultimate control and customization, use Filters. This allows you to segment results by any field in the contact’s record. For instance, you may want to calculate revenue by a certain product.
Relevant Articles
Try Graphly for Just $1!
Unlock the full potential of your data with Graphly! Sign up for our 14-day trial for only $1 and gain access to a wide range of powerful reports designed to help you make data-driven decisions. Here are some of the reports you can explore:
- Opportunity Leaderboard: Track and analyze your team’s performance.
- Gross Revenue: See the money coming into your Keap account over time.
- Opportunity Forecast: Forecast the adjusted revenue of active opportunities based on the stage probability.
- Units Sold: See the number of units sold for each product you select over a given date range.
- Campaign Email Stats: Measure the impact and conversion of your marketing campaigns.
- Tags Applied: See how many tags get applied to contacts during a period of time.
Don’t miss out on this limited-time offer! Start Your 14-Day $1 Trial Now.