The Opportunity Forecast template allows you to forecast the adjusted revenue of active opportunities based on the stage probability.
Search for the Opportunity Forecast Template
To begin, click the “+” icon on the Dashboard and type “forecast” in the search bar. Then select the “Opportunity Forecast” template.
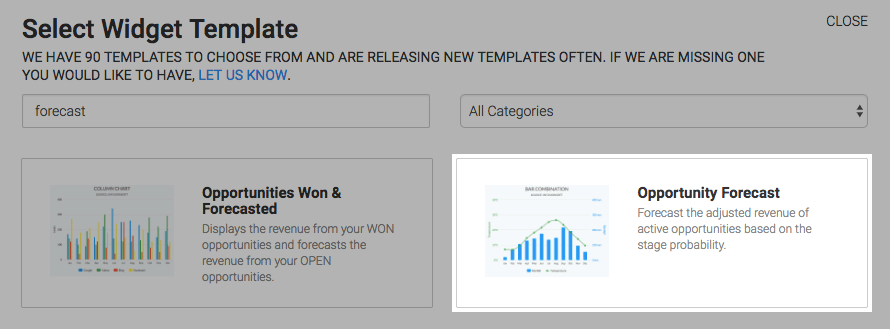
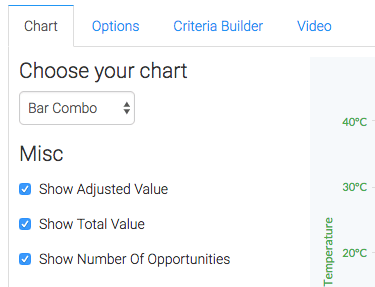
Chart Tab
The only chart type for this template is Bar Combo where the columns display the revenue and the line shows the number of opportunities the revenue represents. Below that are a few checkboxes. If checked these values will be displayed in the top-right hand corner of the chart.
Options Tab
Now navigate to the Options tab and add all of your open stages. It is common to add these in the same order a prospect would travel through your pipeline, but if for any reason you need to change the order; they are drag and droppable.
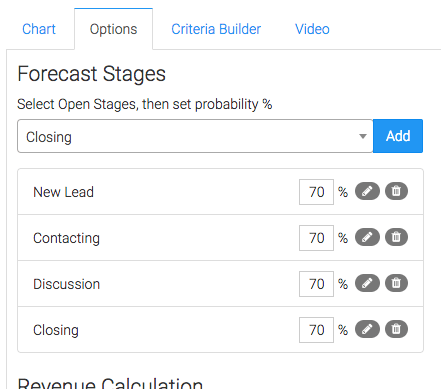
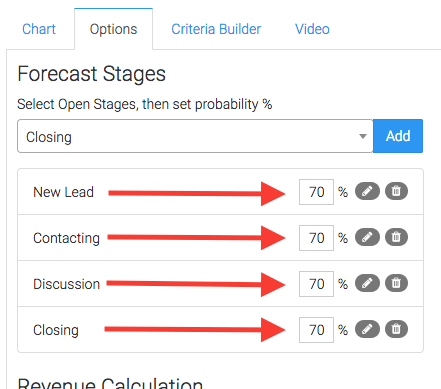
You can also change the probability percentage for each stage here.
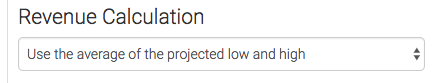
Next, choose your method for revenue calculation.
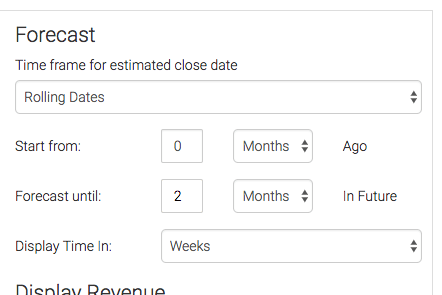
Then choose the time frame for your forecast.
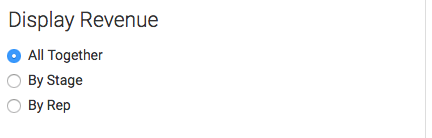
The next option Display Revenue will greatly impact the look and feel of your chart. By selecting All Together, all opportunity stages will be reported together for each unique time interval. The By Stage option will separate opportunity stages at each time interval. The By Rep option will separate your results by each individual sales rep so you can compare the pipeline side by side.
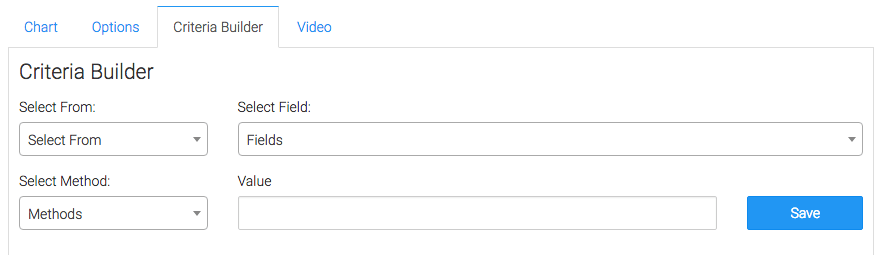
Criteria Builder Tab
For ultimate control and customization, use the Criteria Builder to include additional rules and requirements to the report. A perfect use of criteria builder for this report template would be limiting the report to only return opportunities where the Committed to Forecast is set to yes.
Once you have your everything set, click Save Preferences on This Widget.
Relevant Articles
- How to Configure an Opportunity Attribution Report
- How to Configure the Opportunity Stage Goal Report
- How to Set Up the Opportunity Funnel Report
Try Graphly for Just $1!
Unlock the full potential of your data with Graphly! Sign up for our 14-day trial for only $1 and gain access to a wide range of powerful reports designed to help you make data-driven decisions. Here are some of the reports you can explore:
- Opportunity Leaderboard: Track and analyze your team’s performance.
- Gross Revenue: See the money coming into your Keap account over time.
- Opportunity Forecast: Forecast the adjusted revenue of active opportunities based on the stage probability.
- Units Sold: See the number of units sold for each product you select over a given date range.
- Campaign Email Stats: Measure the impact and conversion of your marketing campaigns.
- Tags Applied: See how many tags get applied to contacts during a period of time.
Don’t miss out on this limited-time offer! Start Your 14-Day $1 Trial Now.