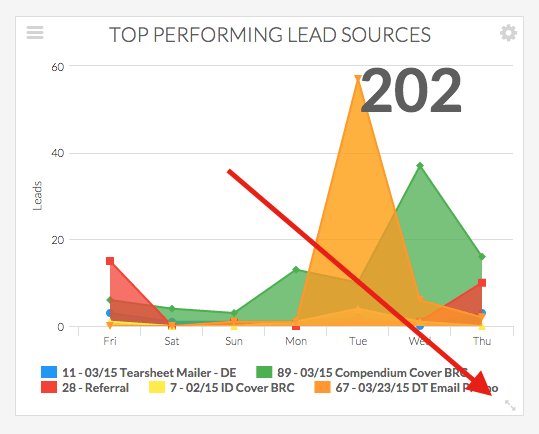
Resizing Graphly Reports
After your Graphly Reports are created, you have the option to make them any size you desire. Simply hover the cursor over the report until you see a small symbol in the bottom right corner appear. The symbol should be two arrows going in opposite directions. Click, hold, and then drag to the desired size. Dotted lines should appear to show you the new size of the report.
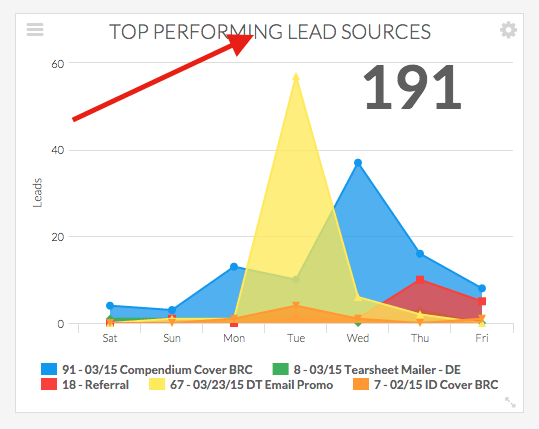
Moving a Graphly Report
Once the report is the right size you can move it without changing the size of it. Hover the cursor over the top center of the widget where the name of the graph is. Click and drag to move the report around your dashboard. The other reports in your dashboard will move around to show you where they will end up once you release the mouse.
Your cursor will turn into a hand if you are in the right spot like this:

Once you’ve got your dashboard looking good, build out some more dashboards! If you like what Graphly brings to the table, help us out by giving us a five-star review on the Keap store!
Relevant Articles
Try Graphly for Just $1!
Unlock the full potential of your data with Graphly! Sign up for our 14-day trial for only $1 and gain access to a wide range of powerful reports designed to help you make data-driven decisions. Here are some of the reports you can explore:
- Opportunity Leaderboard: Track and analyze your team’s performance.
- Gross Revenue: See the money coming into your Keap account over time.
- Opportunity Forecast: Forecast the adjusted revenue of active opportunities based on the stage probability.
- Units Sold: See the number of units sold for each product you select over a given date range.
- Campaign Email Stats: Measure the impact and conversion of your marketing campaigns.
- Tags Applied: See how many tags get applied to contacts during a period of time.
Don’t miss out on this limited-time offer! Start Your 14-Day $1 Trial Now.