The Record Reveal feature in Graphly is a powerful tool that allows users to gain deeper insights into their data by providing detailed record information directly from a data point in a report. This feature is particularly useful for users who need to analyze specific records within their Keap system without navigating away from Graphly.
How to Use Record Reveal
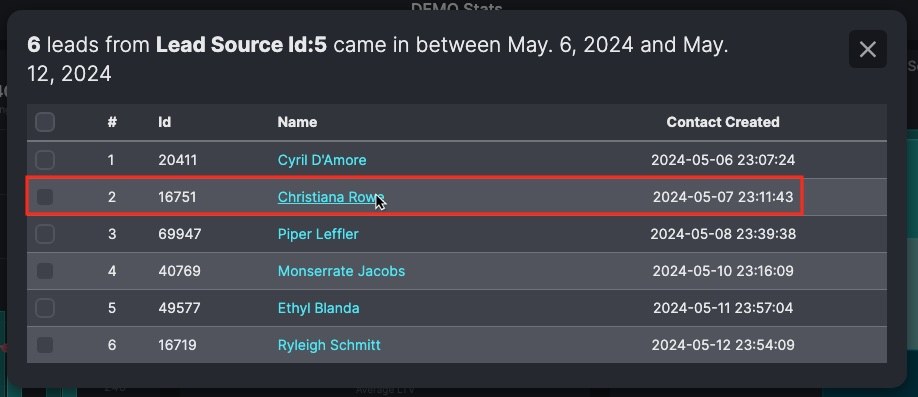
Hover Over and Click a Data Point: In any Graphly report, identify the data point you are interested in. Simply hover your mouse over this data point and click it to trigger Record Reveal.

View the List of Records: A list of records contained within the selected data point will be displayed. Each record in this list is hyperlinked.

Access Records in Keap: Click on any individual record link to open and view the record directly in your Keap account.
Benefits of Record Reveal
- Efficiency: Quickly access detailed information about specific records without leaving the Graphly platform.
- Integration: Seamlessly integrates with Keap, allowing direct access to individual records for further analysis or action.
- Insight: Provides granular visibility into the data points, enhancing decision-making and operational efficiency.
Example Use Case
Imagine you are analyzing a sales report and you notice a spike in sales for a particular day. Using the Record Reveal feature, you can click on the data point representing that day to see all the sales records. You can then click on individual records to view detailed information in Keap, such as customer details, products sold, and the sales process, enabling you to understand what drove the spike in sales.
By leveraging the Record Reveal feature, you can ensure that your data analysis is not only high-level but also detailed and actionable, helping you to make informed business decisions.
Conclusion
The Record Reveal feature is an essential tool for any Graphly user looking to dive deeper into their data and seamlessly integrate with Keap. It enhances the utility of Graphly reports by providing direct access to individual records, making your data more actionable and insightful.
For more detailed information and other features, please visit the Graphly Knowledge Base.
Try Graphly for Just $1!
Unlock the full potential of your data with Graphly! Sign up for our 14-day trial for only $1 and gain access to a wide range of powerful reports designed to help you make data-driven decisions. Here are some of the reports you can explore:
- Opportunity Leaderboard: Track and analyze your team’s performance.
- Gross Revenue: See the money coming into your Keap account over time.
- Opportunity Forecast: Forecast the adjusted revenue of active opportunities based on the stage probability.
- Units Sold: See the number of units sold for each product you select over a given date range.
- Campaign Email Stats: Measure the impact and conversion of your marketing campaigns.
- Tags Applied: See how many tags get applied to contacts during a period of time.
Don’t miss out on this limited-time offer! Start Your 14-Day $1 Trial Now.