This article gives a quick tour of your Graphly account with an overview of notable features and locations within the app.
Dashboard
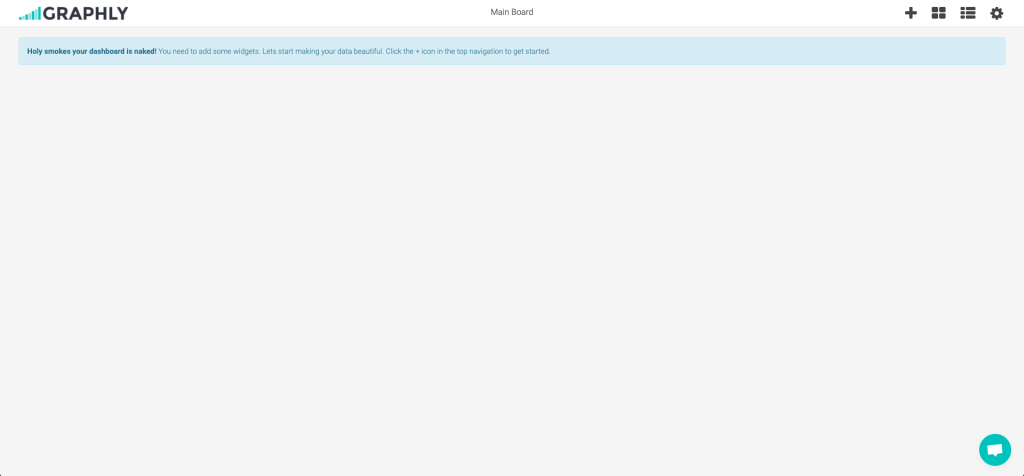
The first thing you see when you log in will be your dashboard. This board is empty until you start adding reports.
Adding a Board
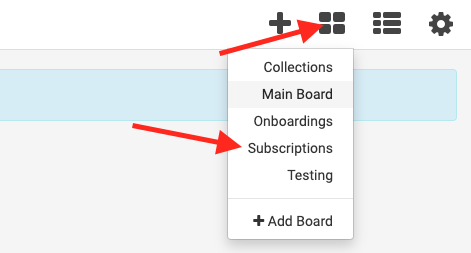
To add another board, click the four square icon in the top-right and select + Add Board.

Give the new board a name and click Create.

Switching Between Boards
To toggle between your different boards, click the four square icon and select the board you would like to visit.
Board Preferences
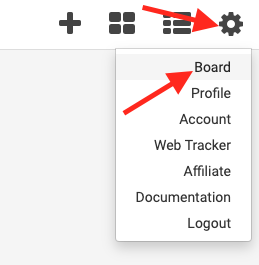
To access the settings of your board, click the gear icon on your dashboard, and select Board.
Settings Tab
The settings tab allows you to change the name of the board, and assign it to a different user.

Share Tab
The Share tab allows to to select other users to share the board with.

Public Tab
The Public tab allows you to generate a public link to the current dashboard.

Template Library
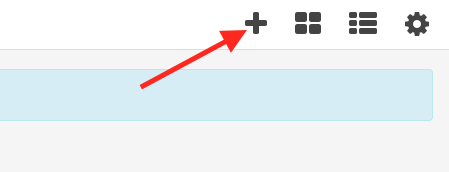
To access you Template Library, click the + icon at the top of your dashboard.
You can filter the library by clicking on the category drop-down to the right, or by searching for a key word.

Reports
Resize & Move Reports
To resize an existing report, click and drag either of the bottom corners to the desired size and proportions.
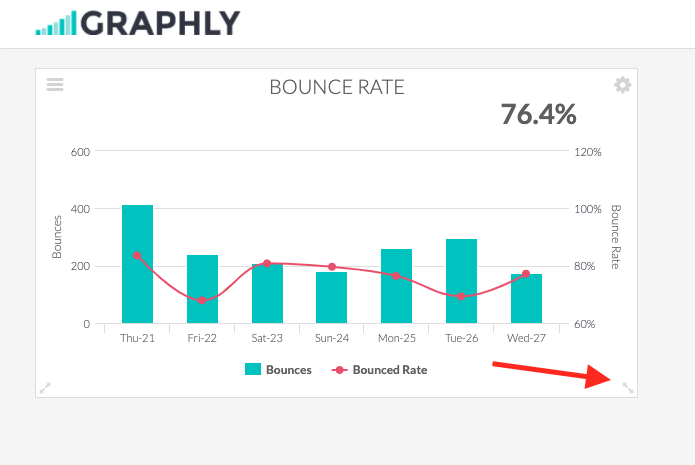
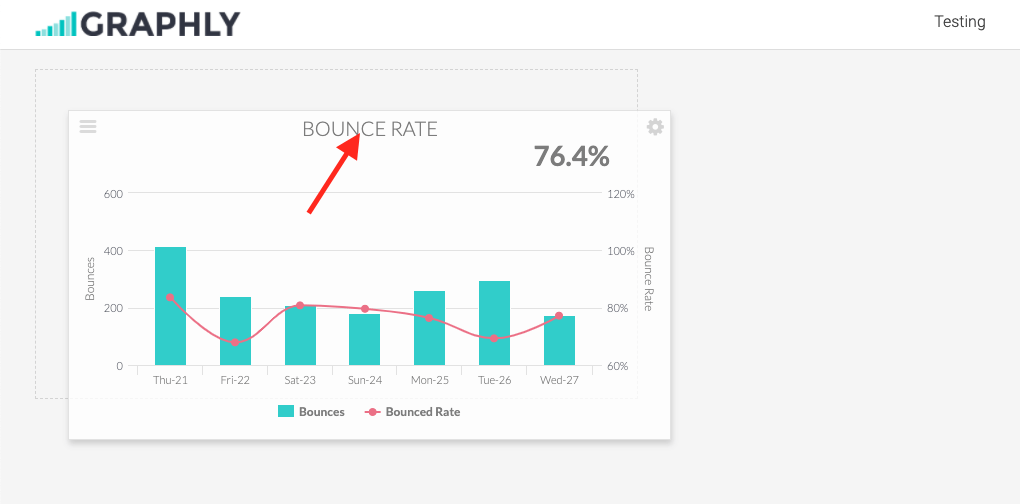
To move a report, click the title and drag it where you want it to live.
Editing Reports
To Edit an Existing report, click the gear icon in the top right-hand corner of the report.
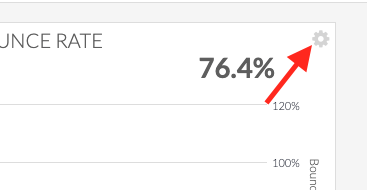
After making changes to a report, click the save preferences on this widget button.

Deleting Reports
While in the settings of a report, click the red trash can icon, then select Delete to confirm.


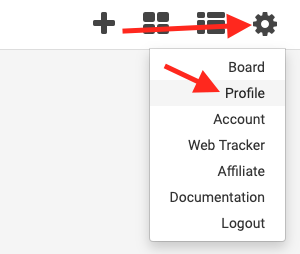
Profile
To access the Profile settings, where your personal user information is stored, click the gear icon on your dashboard and select Profile.
Profile Tab
To change any information pertaining to your specific user, make any changes on this tab and click the Update Profile button near the bottom.

Theme Tab
On the Theme tab, you can choose the skin and color palette of your Graphly account. I’m definitely not biased, but Dark is the best theme. 😉

Extensions Tab
In order to view Graphly within your Keap account (more info on that here) you’ll need to download the Firefox addon or Chrome extension, depending on which browser you use.

Account Settings
To access your account settings, click the four square icon (again) and select Account.

Settings Tab
On this tab, you can change the name of the Account, the Owner, and the Currency and Timezone that reports display in.

Users Tab
The Users tab allows you to invite new users, or edit existing users. For more information on users, click here.

Invoices Tab
The invoices tab allows you to pay on and download invoices for the last 18 months.

Relevant Articles
- How to Add Another Keap Application to your Graphly Account
- How to Add Graphly as a Native Mac OS Desktop App
Try Graphly for Just $1!
Unlock the full potential of your data with Graphly! Sign up for our 14-day trial for only $1 and gain access to a wide range of powerful reports designed to help you make data-driven decisions. Here are some of the reports you can explore:
- Opportunity Leaderboard: Track and analyze your team’s performance.
- Gross Revenue: See the money coming into your Keap account over time.
- Opportunity Forecast: Forecast the adjusted revenue of active opportunities based on the stage probability.
- Units Sold: See the number of units sold for each product you select over a given date range.
- Campaign Email Stats: Measure the impact and conversion of your marketing campaigns.
- Tags Applied: See how many tags get applied to contacts during a period of time.
Don’t miss out on this limited-time offer! Start Your 14-Day $1 Trial Now.