This template allows you to compare the cost you have acquired vs the revenue you have made based on facebook.
Setting Up the Facebook Cost vs Revenue Report
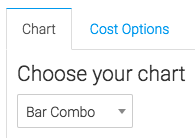
From the chart tab you’ll see this report can only be shown as a bar combo.
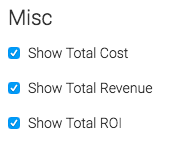
Below that, we have the ability to show the total cost, total revenue, total leads, and total ROI in the top right hand of the chart by checking these boxes.
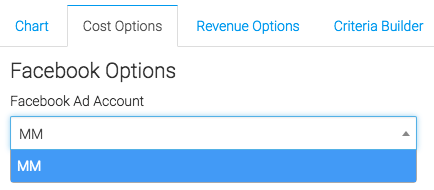
Now let’s go to the cost “Options” tab. First, we need to select the Facebook account we would like to use.
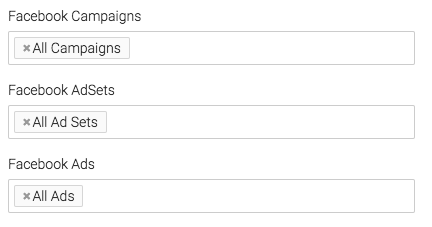
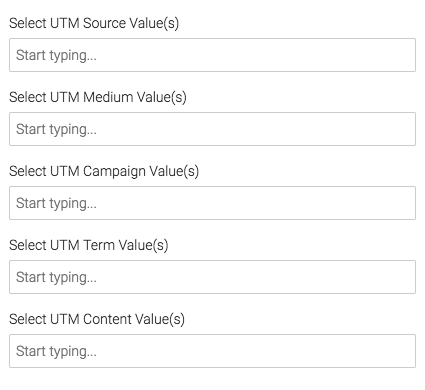
Next, we can narrow our results by looking at specific campaigns, ads, and adsets.
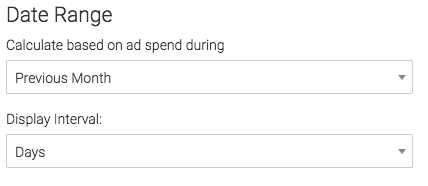
Then you’ll want to choose your date range.
By default, Graphly will use Facebook ad ID’s to associate the correct expenses with each ad.
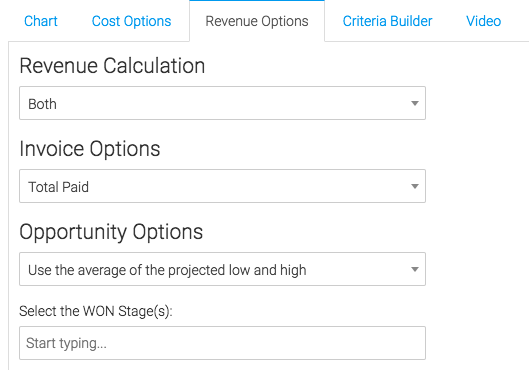
Now we can go to the “Revenue Options” tab. This tab pulls in revenue pulled in using Infusionsoft.
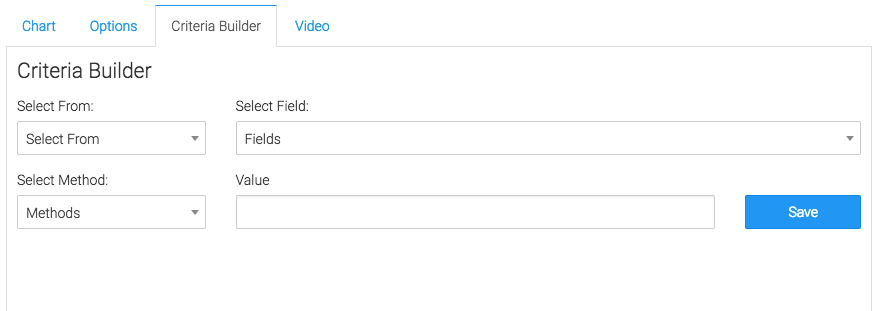
Criteria Builder
For ultimate control and customization, use the criteria builder. This will allow you to filter results based off of almost any field in the contact record.
Relevant Articles
- Facebook Ads Reporting with Graphly Setup Guide
- How to Set Up the Facebook Clicks Report
- Facebook Age Breakdown
Create Your Free Graphly Dashboard
You don’t need to struggle to find the data you need from your Infusionsoft or Keap application. Create a free visual dashboard using the Graphly Lite plan. Using Graphly Lite, you get 1 user, 2 dashboards, and access to our 10 most widely used report templates. These templates include:
- Tags Applied
- Tags Applied Goal
- Leads
- Gross Revenue
- Appt | Note | Task Summary
- Email List Health
- Refunds
- Campaign Email Stats
- Text Widget Area
If you don’t already have a Graphly account, click here to get a Graphly Lite account so you can start making more informed decisions and grow your business.