This template allows you to see the bounce rate of visits to your website.
Find the Bounce Rate Report
To begin, click the “+” icon on the Dashboard and type bounce into the search bar. Then select the Bounce Rate template.
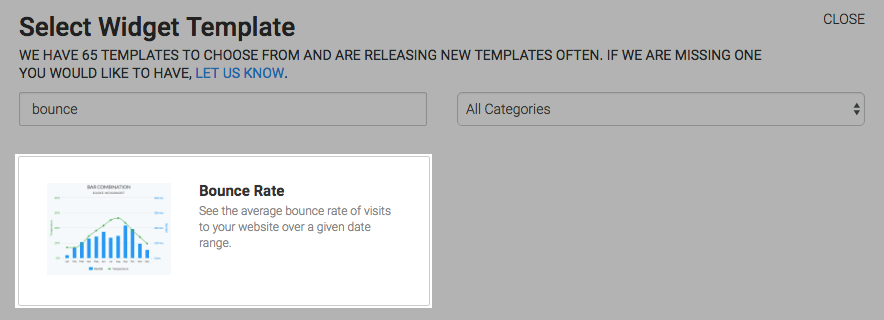
Chart Tab
Display Type
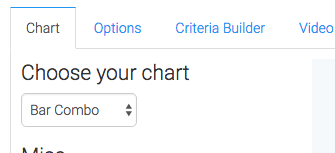
There is only one chart type for this widget which is Bar Combo.
Miscellaneous
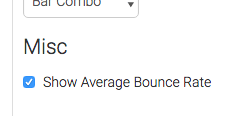
Checking the Show Average Bounce Rate box will make the average bounce rate for the specified date range be displayed in the top-right hand corner of the report.
Options Tab
Date Range
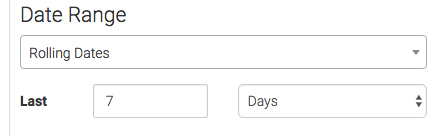
Now navigate to the Options tab and choose a date range.
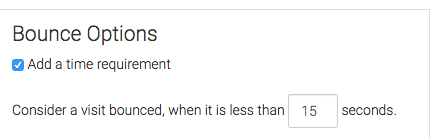
Bounce Options
Next choose your Bounce Options. If you check this box anything less than the number you input here will be a bounce.
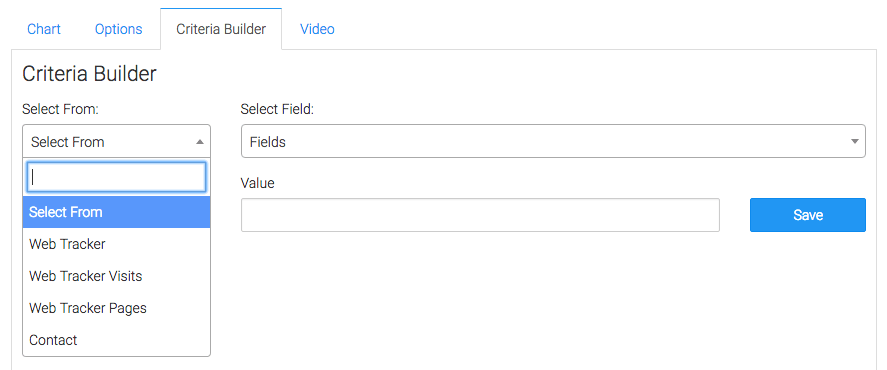
Criteria Builder Tab
Now you can use the Criteria Builder tab to make tons of reports with this single report template. The Web Tracker table allows us to narrow down web tracker accounts, Web Tracker Visits allows you to specify utm data or visit length, and the Web Tracker Pages allow you to select specific domains or paths. You can also add criteria from the contact record. Just know that by doing so, you’ll limit the bounce results to visits made by visitors who also have a contact record in your Infusionsoft account.
Once you’ve got all that set, click on the blue button at the bottom to save your preferences for this widget.
Relevant Articles
- How to Set Up and Configure Graphly’s Web Tracker
- How to Clean Up Lead Sources Using Graphly’s Consolidator
- Integrating Google Tag Manager & Web Tracker
If you don’t already have a Graphly account, you can sign up for free here to get powerful Infusionsoft reporting.