This template allows you to see the average number of pages viewed per visit to your website over a given date range. You will need to have set up Graphly’s Web Tracker for your site. You can see how to do that here.
Setting Up the Pages Per Visit Report
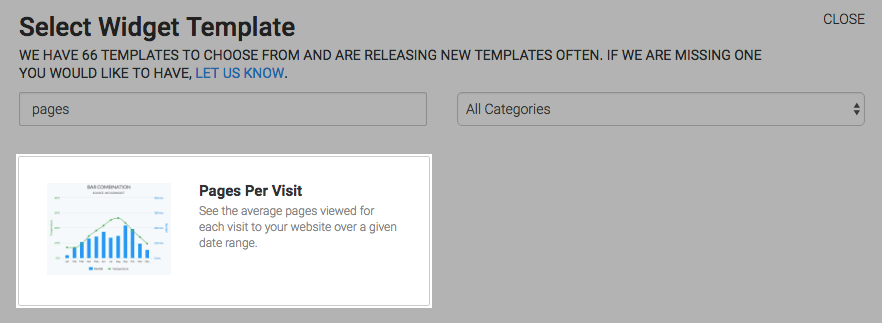
To begin, click the “+” icon on the Dashboard and type “pages” into the search bar. Then select the “Pages Per Visit” template.
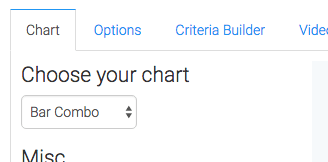
The chart type for this widget is Bar Combo.
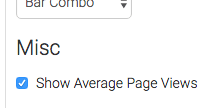
By checking the “Show Average Page Views” box, the average pages viewed per visit for the date range will be shown in the top-right hand corner of the chart.
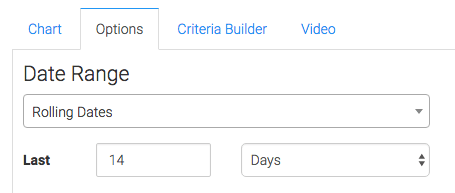
Now navigate to the “Options” tab and select the date range.
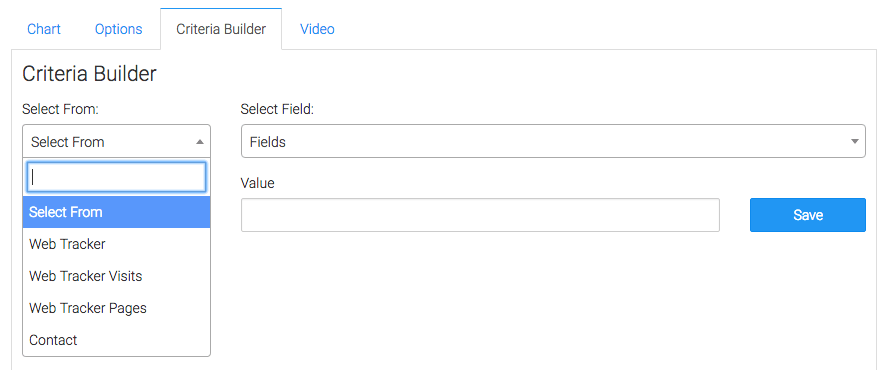
Now you can use the “Criteria Builder” tab to make tons of reports with this single report template. The Web Tracker table allows us to narrow down web tracker accounts, Web Tracker Visits allows you to specify UTM data or visit length, and the Web Tracker Pages allows you to select specific domains or paths. You can also add criteria from the contact record. Just know that by doing so, you’ll limit the results to only those visitors who also have a contact record in your Infusionsoft account.
Once you’ve got all that set, click on the blue button at the bottom to save your preferences for this widget.
Relevant Articles
Create Your Free Graphly Dashboard
You don’t need to struggle to find the data you need from your Infusionsoft or Keap application. Create a free visual dashboard using the Graphly Lite plan. Using Graphly Lite, you get 1 user, 2 dashboards, and access to our 10 most widely used report templates. These templates include:
- Tags Applied
- Tags Applied Goal
- Leads
- Gross Revenue
- Appt | Note | Task Summary
- Email List Health
- Refunds
- Campaign Email Stats
- Text Widget Area
If you don’t already have a Graphly account, click here to get a Graphly Lite account so you can start making more informed decisions and grow your business.